
BIOL-367 · Lesson 5 of 12 · 27 min
Threats II: overexploitation, pollution, disease and climate change
The second group of threats includes some of the oldest and some of the newest pressures on wildlife. People have hunted and fished species to extinction for thousands of years, from the moa of New Zealand to the great auk of the North Atlantic. Pollution became a major threat with industrialization and the agricultural chemicals of the twentieth century. Emerging wildlife diseases spread by global trade have caused some of the fastest declines ever recorded, and climate change is now altering the conditions to which every species is adapted. This lesson examines each in turn, with a model of harvesting that shows why fisheries so often collapse.
Overexploitation
Overexploitation means harvesting a population faster than it can replace itself. It is the leading direct driver of biodiversity loss in the ocean and remains a major threat on land, especially for large animals with slow reproduction. North American history provides stark examples. The plains bison, which numbered in the tens of millions before European colonization, was reduced to fewer than a thousand animals by the late 1880s, partly through commercial hunting for hides and partly as a deliberate strategy to undermine the Indigenous nations of the plains who depended on bison. Beaver were trapped out of much of the continent during the fur trade. Market hunting of shorebirds, waterfowl and the passenger pigeon in the nineteenth century led to the first wildlife laws, including the Migratory Birds Convention between Canada, through Britain, and the United States in 1916.
Today the most important forms of overexploitation are industrial fishing, logging of old-growth forests, the international trade in wildlife and wildlife products, and hunting for meat in tropical regions, often called bushmeat hunting. The Food and Agriculture Organization of the United Nations estimates that over a third of assessed marine fish stocks are fished at biologically unsustainable levels. The illegal wildlife trade, worth billions of dollars a year, drives the poaching of elephants for ivory, rhinoceroses for horn and pangolins for scales and meat; pangolins are among the most trafficked mammals in the world. The Convention on International Trade in Endangered Species of Wild Fauna and Flora (CITES), in force since 1975, regulates trade in listed species through permits, and lesson 9 returns to it.
Surplus production and maximum sustainable yield
Fisheries scientists traditionally manage harvests using surplus production models. Suppose a population grows logistically, as described in BIOL-208, with intrinsic rate of increase \(r\) and carrying capacity \(K\). Its growth rate, the surplus available for harvest without reducing the population, is
where \(H\) is the harvest per unit time. Surplus production is zero when the population is very small, because there are few breeders, and zero at carrying capacity, because there is no room for growth. It peaks at \(N = K/2\), where the surplus is \(rK/4\). This peak is the maximum sustainable yield (MSY): in theory, a population held at half its carrying capacity can yield \(rK/4\) each year indefinitely.
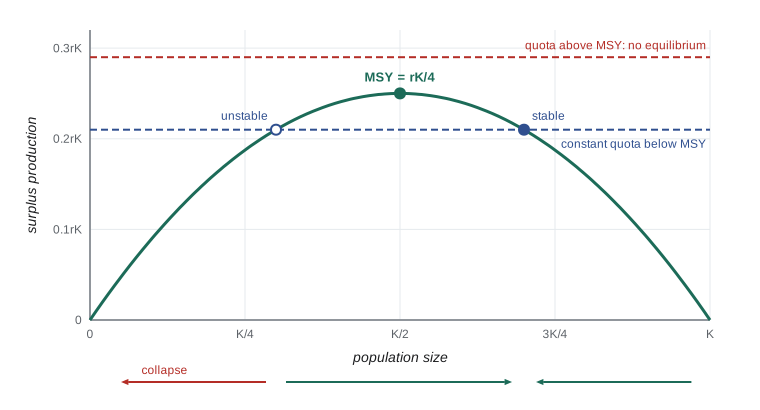
The figure reveals a danger hidden in constant-quota management. If the annual harvest is a fixed amount below MSY, the harvest line crosses the production curve at two points. The upper point is stable: if the population rises above it, harvest exceeds production and the population falls back; if it falls slightly below, production exceeds harvest and it recovers. The lower point is unstable: below it, harvest exceeds production at every population size, and the population declines to extinction unless the quota is cut. A quota set above MSY has no equilibrium at all. A bad year, an overestimate of stock size or a quota set too close to MSY can push a population past the unstable point, and the collapse then accelerates.
# Logistic stock under a constant annual quota (invented parameters, not a real fishery).
r, K = 0.4, 1000.0            # thousand t; MSY = rK/4 = 100
def run(quota, N0=600.0, years=40, shock_year=None, shock=0.0):
    N, path = N0, []
    for t in range(years):
        if t == shock_year:
            N *= (1 - shock)          # a bad recruitment year or an overestimate of the stock
        N = max(N + r * N * (1 - N / K) - quota, 0.0)
        path.append(N)
    return path
for quota in (60, 90, 99, 110):
    p = run(quota)
    print(f"quota {quota:3d}: stock after 10, 20, 40 years = {p[9]:6.0f} {p[19]:6.0f} {p[39]:6.0f}")
# Same quota of 90, but a 50% drop in year 5
p = run(90, shock_year=5, shock=0.5)
print("quota  90 with a 50% shock in year 5: " + " ".join(f"{x:4.0f}" for x in p[3:16]))
# Proportional harvest: take a fixed fraction F of the stock each year instead
N = 600.0
for t in range(40):
    if t == 5: N *= 0.5
    N = N + r * N * (1 - N / K) - 0.2 * N
print(f"fixed fraction F = 0.2 with the same shock: stock after 40 years = {N:.0f}")quota 60: stock after 10, 20, 40 years = 797 815 816 quota 90: stock after 10, 20, 40 years = 640 653 658 quota 99: stock after 10, 20, 40 years = 578 567 557 quota 110: stock after 10, 20, 40 years = 487 368 0 quota 90 with a 50% shock in year 5: 621 625 309 304 299 292 285 277 267 255 241 224 203 fixed fraction F = 0.2 with the same shock: stock after 40 years = 500
With a quota of 60, well below the MSY of 100, the stock settles at a high level. A quota of 90 also seems sustainable, but the same quota combined with a single bad year that halves the stock drives it below the unstable equilibrium, which for this quota lies at about 340 thousand metric tons, and from then on it declines at an accelerating rate toward collapse, even though the quota never changed. A quota just below MSY leaves the stock hovering near the dangerous zone, and a quota above MSY destroys it. A proportional harvest, which takes a fixed fraction of the stock each year, is much more robust, because the catch automatically falls when the stock falls. Modern fisheries management builds in this kind of feedback through harvest control rules that cut fishing as a stock approaches a limit reference point, part of the precautionary approach.
Real fisheries are more complicated than this model. Stock assessments are uncertain; fishing technology improves so that catch per unit effort can remain high while stocks fall, a phenomenon called hyperstability; fishing removes the largest, oldest fish first, which are often the most productive spawners; and economic and political pressures push quotas upward. Many fisheries scientists now regard MSY as an upper limit to be avoided rather than a target, and ecosystem-based fisheries management considers the effects of fishing on predators, prey and habitats.
The collapse of northern cod
The northern cod stock off eastern Newfoundland and southern Labrador supported one of the world's great fisheries for nearly five centuries. After the arrival of factory trawlers in the 1960s, catches peaked at about 800,000 metric tons in 1968 and then fell. Canada extended its fisheries jurisdiction to 200 nautical miles in 1977, and the domestic fleet expanded in the expectation that the stock would rebuild. Scientific assessments in the 1980s overestimated the stock, partly because commercial catch rates stayed high as boats concentrated on the remaining fish, and partly because inshore fishers' warnings of declining catches were discounted. In July 1992 the federal government declared a moratorium on the fishery. Some 30,000 to 40,000 people in Newfoundland and Labrador lost their jobs in the largest layoff in Canadian history.
The stock did not recover as expected. For more than two decades it remained at a small fraction of its former size, possibly because of changes in the ecosystem: seals, shrimp and crab became more abundant, the cold intermediate layer of the ocean changed, and capelin, the main prey of cod, declined. Small fisheries were allowed in later years, and in 2024 Fisheries and Oceans Canada concluded that the stock had moved out of the critical zone and reopened a commercial fishery with a larger quota, a decision some scientists criticized as premature because the stock remained well below historical levels. The northern cod story illustrates the costs of overconfidence in stock assessments, the importance of local knowledge and the slowness of recovery after collapse.
Pollution
Pollution threatens biodiversity through toxic chemicals, excess nutrients, plastics, noise and light. The story of DDT is the classic example. DDT, an organochlorine insecticide widely used after the Second World War, is persistent and fat-soluble, so it accumulates in the tissues of organisms and becomes more concentrated at each step up a food chain, a process called biomagnification. Its breakdown product DDE interferes with calcium deposition in eggshells, and in the 1950s and 1960s populations of peregrine falcons, bald eagles, ospreys and brown pelicans crashed as their thin-shelled eggs broke during incubation. The peregrine falcon disappeared as a breeding bird from eastern North America. After Canada and the United States restricted and then banned most uses of DDT in the early 1970s, and after captive breeding and reintroduction programs, these birds recovered; the bald eagle was removed from the US endangered species list in 2007.
Other pollutants continue to be serious. Mercury from coal combustion and mining accumulates in fish-eating birds and mammals such as common loons. Lead poisoning from spent ammunition and fishing tackle kills eagles, condors and loons; it is the leading obstacle to the recovery of the California condor. Excess nitrogen and phosphorus from fertilizers and sewage cause eutrophication, algal blooms and low-oxygen dead zones, such as the recurring harmful algal blooms of western Lake Erie and the large hypoxic zone that forms each summer off the mouth of the Mississippi River. Neonicotinoid insecticides have been linked to declines in bees and insect-eating birds, and both countries have restricted some uses. Plastic debris entangles and is swallowed by seabirds, turtles and marine mammals, and microplastics are now found throughout food webs. Artificial light at night disorients migrating birds and hatchling sea turtles, and ocean noise from ships and seismic surveys interferes with communication by whales.
Wildlife disease
Emerging infectious diseases of wildlife, often spread by human movement of animals, have caused some of the most dramatic declines on record. The chytrid fungus Batrachochytrium dendrobatidis (Bd) infects the skin of amphibians, disrupting their regulation of water and salts. Spread around the world probably through the trade in amphibians, it has been linked to declines in at least 500 amphibian species and the presumed extinction of about 90, according to a 2019 study led by Ben Scheele, making it the most destructive pathogen of biodiversity yet recorded. A related fungus, Batrachochytrium salamandrivorans (Bsal), which is lethal to many salamanders, has spread from Asia into Europe; it has not yet been detected in North America, which has the world's highest diversity of salamanders, and both Canada and the United States have restricted imports of salamanders to keep it out.
White-nose syndrome, caused by the fungus Pseudogymnoascus destructans, was first documented in a cave near Albany, New York, in 2006, probably introduced from Europe on the gear or clothing of cave visitors. The fungus grows on the muzzles and wings of hibernating bats, causing them to wake repeatedly and exhaust their fat reserves. It has spread across much of North America, reaching Canada by 2010, and has killed millions of bats; populations of little brown myotis, northern myotis and tri-colored bats have declined by more than 90 percent in many affected regions. In Canada, these three species were listed as endangered under the Species at Risk Act through an emergency assessment in 2014. Other diseases of concern include chronic wasting disease, a fatal prion disease of deer, elk, moose and caribou that is spreading in both countries; sea star wasting disease, which devastated sunflower sea stars along the Pacific coast after 2013 and contributed to the spread of urchin barrens in kelp forests; and highly pathogenic avian influenza H5N1, which since 2021 has killed wild birds and mammals on an unprecedented scale.
Climate change
Climate change affects species through rising temperatures, changing precipitation, more frequent extreme events, sea-level rise, melting ice and ocean acidification. Species respond in three main ways: they move, they adjust, or they decline. Many species are shifting their ranges toward the poles and to higher elevations; a 2011 analysis by I-Ching Chen and colleagues estimated average shifts of about 17 kilometers per decade in latitude and 11 meters per decade in elevation. Species are also changing their timing, or phenology: many plants flower earlier and many birds migrate and breed earlier. If species shift at different rates, interactions can be disrupted, a problem called phenological mismatch, as when caterpillars peak before the nestlings that feed on them hatch.
Some species cannot move fast enough or have nowhere to go. Mountaintop species such as the American pika and white-tailed ptarmigan face shrinking habitat as climate zones move upslope. Polar bears depend on sea ice to hunt seals, and the Western Hudson Bay population has declined as the ice-free season has lengthened. Reef-building corals bleach when water temperatures rise, and the global bleaching event that began in 2023 affected reefs in dozens of countries. Climate change also interacts with other threats: fragmented landscapes make it harder for species to shift their ranges, warmer winters allow pests such as the mountain pine beetle to expand, and drought and heat increase the frequency of severe wildfires. Lesson 7 discusses connectivity for climate adaptation and lesson 10 discusses assisted migration.
Synergies among threats
Threats rarely act alone. A frog population may be reduced by habitat loss, exposed to pesticides that weaken its immune system and then infected by chytrid, which grows best within a range of temperatures that climate change makes more frequent. A study by Barry Brook, Navjot Sodhi and Corey Bradshaw in 2008 reviewed many such interactions and concluded that synergies are common and that conservation focusing on a single threat may fail. Practically, this means that removing the most tractable threat, such as a local pollution source, can buy time for a species even if other threats, such as climate change, cannot be stopped locally.
Worked problem
Setting a safe quota
A fish stock is estimated to have r = 0.5 per year and K = 200,000 metric tons, with large uncertainty. What is MSY, and why might a manager set the quota well below it?
Show solution
- MSY = \(rK/4 = 0.5 \times 200{,}000 / 4 = 25{,}000\) metric tons per year, achieved at a stock of 100,000 metric tons.
- If both r and K are overestimated by 25 percent, the true values are 0.4 and 160,000 metric tons and the true MSY is only 16,000 metric tons; a quota of 25,000 would exceed it, driving the stock down with no equilibrium.
- Even if the estimates are right, a quota near MSY places the unstable equilibrium close to the stable one, so a bad year could trigger collapse.
- A precautionary manager might set the quota at perhaps two thirds of the estimated MSY and use a harvest control rule that reduces catches if surveys show the stock falling.
Answer: MSY is about 25,000 metric tons per year in theory, but uncertainty and variability justify a lower quota with feedback rules. This is the logic of the precautionary approach.
Common mistakes
MistakeTreating maximum sustainable yield as a safe target.
InsteadMSY is an upper limit under ideal conditions; uncertainty and variability make it risky as a target.
MistakeAssuming stable catch rates mean a stable stock.
InsteadHyperstability can keep catches high as fish concentrate and technology improves while the stock declines.
MistakeThinking DDT harmed birds by killing adults directly.
InsteadIts metabolite DDE thinned eggshells, causing reproductive failure.
MistakeAssuming collapsed fish stocks recover quickly once fishing stops.
InsteadEcosystem changes can delay recovery for decades, as with northern cod.
MistakeTreating climate change as a separate threat from habitat loss.
InsteadFragmented landscapes block range shifts, and threats often act synergistically.
Summary and key terms
- Overexploitation reduced bison, beaver and many birds historically and remains the leading driver of loss in the ocean.
- In the logistic model, surplus production peaks at K/2 with MSY = rK/4.
- Constant quotas create an unstable lower equilibrium; shocks can trigger collapse, while proportional harvests are more robust.
- Northern cod collapsed under overestimated assessments and was placed under moratorium in 1992; recovery has been slow.
- DDT biomagnified and thinned eggshells of raptors; bans led to recovery. Lead, mercury, nutrients, plastics, light and noise remain threats.
- Chytrid fungus, white-nose syndrome, chronic wasting disease and avian influenza have caused major wildlife declines.
- Climate change shifts ranges and phenology, threatens mountaintop and ice-dependent species, and interacts with other threats.
- overexploitation
- Harvesting a population faster than it can replace itself.
- surplus production
- The growth of a population available for harvest without reducing its size.
- maximum sustainable yield
- The largest harvest that can in theory be taken each year indefinitely, rK/4 in the logistic model.
- harvest control rule
- A pre-agreed rule that adjusts catches according to stock status.
- hyperstability
- Catch rates that stay high while the underlying stock declines.
- biomagnification
- The increase in concentration of a persistent chemical at higher trophic levels.
- eutrophication
- Enrichment of water with nutrients leading to algal blooms and oxygen depletion.
- chytridiomycosis
- A skin disease of amphibians caused by chytrid fungi.
- white-nose syndrome
- A fungal disease of hibernating bats that depletes their fat reserves.
- phenology
- The timing of seasonal biological events such as flowering, migration and breeding.
- phenological mismatch
- Disruption of interactions when species shift their timing at different rates.
Practice problems
Work each problem on paper first, then reveal the answer to check.
Calculate MSY for r = 0.3 and K = 50,000.
Show answer
rK/4 = 3,750 per year at a stock of 25,000.
Why is the lower equilibrium under a constant quota unstable?
Show answer
Below it, harvest exceeds production so the population falls further; above it, the population grows away from it.
Why is a proportional harvest more robust than a constant quota?
Show answer
The catch falls automatically when the stock falls, so harvest never exceeds production at low stock sizes.
Give two reasons the northern cod collapse was not predicted.
Show answer
Assessments overestimated the stock, and hyperstable catch rates and dismissed inshore observations hid the decline.
How did DDT affect raptors?
Show answer
DDE thinned eggshells, causing eggs to break and breeding to fail.
What is the leading obstacle to California condor recovery?
Show answer
Lead poisoning from spent ammunition in carcasses.
How does white-nose syndrome kill bats?
Show answer
It causes bats to wake repeatedly during hibernation and use up their fat reserves.
Name two ways species respond to climate change.
Show answer
Range shifts toward poles or higher elevations, and changes in phenology.
Lesson quiz · 5 questions
Score 60% or more to complete this lesson.
Create a free account to save your progress, take quizzes and earn a certificate.