
BIOL-340 · Lesson 3 of 12 · 34 min
Photosynthesis I: light reactions
Nearly all the energy that flows through living things on land entered the biosphere through the light reactions of photosynthesis. In thylakoid membranes, pigment–protein complexes absorb photons, use their energy to pull electrons from water, push those electrons uphill in energy to reduce NADP⁺, and use the flow of electrons to pump protons and make ATP. Oxygen is released as a by-product, and that by-product transformed the atmosphere of the planet. BIOL-107 introduced the overall reaction, the chloroplast and a simplified version of the light reactions. This lesson takes the light reactions apart at the depth of a plant physiology course: how pigments capture and pass on energy, how the two photosystems work in series, why the energetics require two photons per electron, how ATP and NADPH production are balanced, how plants avoid damage from too much light, and how physiologists measure photosynthesis in leaves.
Light and pigments
Light behaves as a stream of photons whose energy is inversely proportional to wavelength: \(E = hc/\lambda\). A mole of photons, sometimes called an einstein, of red light at 680 nm carries about 176 kJ; a mole of blue photons at 450 nm carries about 266 kJ. Photosynthetically active radiation, the band from 400 to 700 nm, makes up a little under half of the energy in sunlight reaching the ground, and full summer sunlight delivers roughly 2,000 µmol of photons per square meter per second in that band. Plant physiologists measure light for photosynthesis as photon flux density in µmol m⁻² s⁻¹ rather than in watts, because each photon absorbed drives the same photochemistry whatever its wavelength.
Chlorophylls absorb strongly in the blue and red and weakly in the green, which is why leaves look green. Chlorophyll a is the pigment of the reaction centers; chlorophyll b, which differs by one formyl group, absorbs at slightly different wavelengths and widens the band of light the antenna can capture. Carotenoids, including β-carotene and the xanthophylls lutein, violaxanthin and zeaxanthin, absorb blue-green light and pass energy to chlorophyll, but their more important role is protective: they quench triplet chlorophyll and singlet oxygen that would otherwise damage the photosynthetic machinery. An absorption spectrum shows how strongly a pigment absorbs each wavelength; an action spectrum shows how effectively each wavelength drives a process such as oxygen evolution. The action spectrum of photosynthesis follows the combined absorption of chlorophylls and carotenoids, with one telling exception.
In the 1940s and 1950s Robert Emerson measured the quantum yield of oxygen evolution in algae and found that it fell sharply at wavelengths beyond about 680 nm, even though chlorophyll still absorbed there, an effect called the red drop. He then found that adding a weak beam of shorter-wavelength light to the far-red beam produced more oxygen than the two beams gave separately. This Emerson enhancement effect was the key clue that photosynthesis uses two photochemical systems working in series, one of which can use far-red light and one of which cannot.
Antennae and reaction centers
Most chlorophyll molecules do not carry out photochemistry. They are part of antenna complexes, arrays of pigments bound to proteins that absorb light and funnel the excitation energy to a reaction center. In plants the main antenna is LHCII, the light-harvesting complex of photosystem II, a trimeric protein that binds chlorophylls a and b and carotenoids and is the most abundant membrane protein on Earth. Energy moves between neighboring pigments by resonance energy transfer, without any movement of electrons, in steps of picoseconds. Because the energy flows downhill toward pigments that absorb at longer wavelengths, it ends up in the reaction center, where a special pair of chlorophyll a molecules, P680 in photosystem II and P700 in photosystem I, named after their absorption maxima in nanometers, uses the energy to transfer an electron to a neighboring acceptor. This charge separation converts light energy into chemical potential energy in less than a nanosecond and with a quantum efficiency close to one.
The Z-scheme
The light reactions move electrons from water, which holds them tightly, to NADP⁺, which accepts them reluctantly. The standard redox potential of the O₂/H₂O couple at pH 7 is about +0.82 V and that of NADP⁺/NADPH is about −0.32 V, so the electrons must be raised by more than 1.1 V. A single photon of red light could, in principle, provide enough energy, but with the losses needed to make each step fast and irreversible, one photosystem cannot span the whole range. Plants therefore use two photosystems in series. Plotted on a scale of redox potential, the path of electrons forms a zigzag lying on its side, the Z-scheme proposed by Robin Hill and Fay Bendall in 1960.
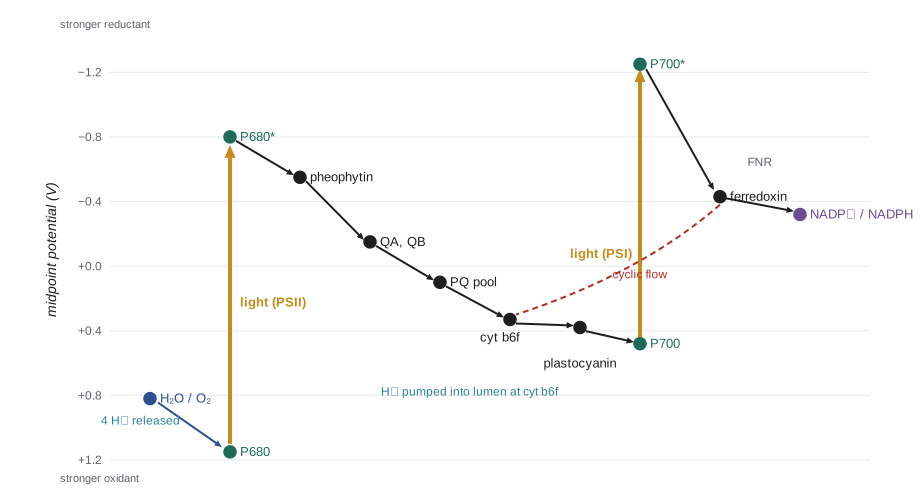
The sequence runs as follows. Photosystem II absorbs light; P680 is excited and gives up an electron to pheophytin, then to two bound plastoquinones, QA and QB. When QB has received two electrons and picked up two protons from the stroma, it leaves its binding site as plastoquinol and diffuses through the membrane. The oxidized P680⁺ is the strongest biological oxidant known, with a potential of about +1.2 V, and it takes electrons, one at a time through a tyrosine residue, from the oxygen-evolving complex. That complex, a cluster of four manganese ions and one calcium ion bridged by oxygen atoms, accumulates four oxidizing equivalents before it splits two water molecules, releasing one O₂ and four protons into the thylakoid lumen.
Plastoquinol carries its electrons to the cytochrome b6f complex, which passes them one at a time to plastocyanin, a small copper protein in the lumen. Through a mechanism called the Q cycle, cytochrome b6f releases more protons into the lumen than plastoquinol alone delivers, so the complex acts as a proton pump. Plastocyanin reduces P700⁺ in photosystem I. When photosystem I absorbs light, excited P700 passes an electron through a chain of chlorophyll, phylloquinone and iron–sulfur clusters to ferredoxin, a soluble iron–sulfur protein in the stroma with a potential near −0.43 V. Ferredoxin–NADP⁺ reductase (FNR) then uses two reduced ferredoxins to make NADPH. Ferredoxin is also a hub: it supplies electrons to nitrite reductase, sulfite reductase, glutamate synthase and the thioredoxin system that switches on the Calvin–Benson cycle in the light (lesson 4).
| Component | Approximate midpoint potential (V) | Role |
|---|---|---|
| P700* (excited) | −1.2 to −1.3 | Strong reductant after photon absorption in photosystem I |
| Ferredoxin | −0.43 | Soluble electron carrier in the stroma; hub for many reductions |
| NADP⁺/NADPH | −0.32 | Final electron acceptor of linear electron flow |
| P680* (excited) | about −0.7 to −0.8 | Reductant after photon absorption in photosystem II |
| Plastoquinone pool | about +0.1 | Mobile two-electron carrier in the membrane |
| Plastocyanin | about +0.37 | Soluble copper protein in the lumen |
| P700⁺ | about +0.45 to +0.5 | Oxidized reaction center of photosystem I |
| O₂/H₂O | +0.82 | Source of electrons |
| P680⁺ | about +1.2 | Oxidant strong enough to extract electrons from water |
Flashes, S-states and the oxygen clock
Pierre Joliot gave dark-adapted algae a series of very short, saturating flashes and measured oxygen released after each. Almost no oxygen appeared after the first two flashes, a burst came after the third, and then oxygen release peaked every four flashes, damping out after a dozen or so as the system lost synchrony. Bessel Kok explained the pattern in 1970: the oxygen-evolving complex cycles through five oxidation states, S0 to S4, advancing one step per photon absorbed by photosystem II, and releases O₂ on the transition from S4 back to S0. In the dark, most complexes sit in S1, so the third flash brings most of them to S4. Occasional misses, flashes that fail to advance a center, and double hits gradually scramble the pattern. The Kok cycle is one of the clearest examples of how a simple kinetic model can reveal the inner workings of an enzyme long before its structure is known; the Mn₄CaO₅ cluster itself was resolved at atomic resolution only in 2011.
Making ATP: chemiosmosis in the thylakoid
Linear electron flow deposits protons in the lumen from two sources: water splitting at photosystem II and the Q cycle at cytochrome b6f. Together they move about three protons into the lumen for every electron that passes from water to NADP⁺. The resulting proton-motive force, mostly in the form of a pH difference of about 2 to 3 units across the thylakoid membrane, drives protons back to the stroma through the chloroplast ATP synthase, a rotary motor like its mitochondrial relative (BIOL-107). The number of protons needed per ATP depends on the size of the rotor ring of c subunits. In spinach chloroplasts the ring has 14 subunits, and one full turn makes three ATP, so about 14/3, or 4.67, protons are needed per ATP.
This stoichiometry raises a problem. Fixing one CO₂ in the Calvin–Benson cycle requires three ATP and two NADPH (lesson 4). Linear electron flow that produces two NADPH moves four electrons and about twelve protons, which make only about 12/4.67, or roughly 2.6, ATP. The shortfall must be made up. Plants fill it mainly through cyclic electron flow around photosystem I, in which electrons from ferredoxin are passed back to the plastoquinone pool and through cytochrome b6f, pumping protons and making ATP without making NADPH. Two pathways carry cyclic flow in plants, one involving the PGR5 and PGRL1 proteins and one involving the NDH complex. Cyclic flow is also essential for C4 photosynthesis, where bundle sheath cells need extra ATP (lesson 4), and for building the pH gradient that triggers photoprotection.
# Energetics of the light reactions
h, c, NA = 6.626e-34, 2.998e8, 6.022e23
F = 96.485   # kJ per volt per mole of electrons

for nm in (450, 550, 680, 700):
    E = h * c / (nm * 1e-9) * NA / 1000
    print(f"{nm} nm: {E:5.0f} kJ per mole of photons")

# Moving 2 electrons from water (+0.82 V) to NADP+ (-0.32 V)
dE = -0.32 - 0.82
dG = -2 * F * dE
print(f"\nstandard free energy to reduce one NADP+ with electrons from water: {dG:.0f} kJ/mol")
photons = 4   # two photons per electron, two electrons
supplied = photons * h * c / (680e-9) * NA / 1000
print(f"energy in 4 red photons: {supplied:.0f} kJ  -> stored as NADPH: {100*dG/supplied:.0f} %")

# ATP balance for fixing one CO2 (3 ATP + 2 NADPH)
H_per_e, H_per_ATP = 3, 14 / 3
atp_linear = 4 * H_per_e / H_per_ATP
print(f"\nATP from linear flow making 2 NADPH: {atp_linear:.2f} (need 3.00)")
shortfall = 3 - atp_linear
print(f"shortfall {shortfall:.2f} ATP = {shortfall*H_per_ATP:.1f} extra protons from cyclic flow")450 nm: 266 kJ per mole of photons 550 nm: 218 kJ per mole of photons 680 nm: 176 kJ per mole of photons 700 nm: 171 kJ per mole of photons standard free energy to reduce one NADP+ with electrons from water: 220 kJ/mol energy in 4 red photons: 704 kJ -> stored as NADPH: 31 % ATP from linear flow making 2 NADPH: 2.57 (need 3.00) shortfall 0.43 ATP = 2.0 extra protons from cyclic flow
The calculation shows why two photons per electron are needed and how much energy is lost along the way. Reducing one NADP⁺ with electrons from water costs about 220 kJ/mol, while four red photons carry about 700 kJ, so only about a third of the absorbed energy is stored in NADPH; the rest is spent making the electron transfers fast and essentially irreversible, which is the price of efficiency in the quantum sense. It also shows that linear flow leaves a shortfall of about 0.4 ATP for every CO₂ fixed, which cyclic electron flow must supply.
Too much light: photoprotection
A leaf in full sun often absorbs more light than it can use. Excess excitation, if not dissipated, produces triplet chlorophyll, which reacts with oxygen to make highly reactive singlet oxygen, and over-reduces the electron transport chain, producing superoxide. Plants have several layers of defense. The fastest is non-photochemical quenching (NPQ), the harmless dissipation of excess excitation as heat in the antenna. When the lumen becomes acidic because electron transport outpaces ATP use, the protein PsbS senses the low pH and switches the antenna into a quenching state, and the enzyme violaxanthin de-epoxidase converts violaxanthin to zeaxanthin, which enhances quenching. This xanthophyll cycle reverses within minutes to hours when light falls. In 2016 researchers showed that speeding up the relaxation of NPQ by overexpressing three genes increased the growth of tobacco plants in fluctuating field light by about 15 percent, and later work reported yield gains in soybean, a striking example of how fundamental photosynthesis research may help crop productivity.
Other mechanisms act over longer times. State transitions shift LHCII between the two photosystems to balance their excitation: when the plastoquinone pool is over-reduced, a kinase phosphorylates LHCII and part of it moves to photosystem I. Plants also repair photosystem II continually. Its D1 protein is damaged by light so often that it is the fastest-turning-over protein in the chloroplast; damaged D1 is removed and replaced, often within half an hour. Under prolonged excess light, leaves adjust their composition, building more electron transport capacity and fewer antennae, and chloroplasts move to the side walls of cells to reduce absorption.
Measuring photosynthesis: light-response curves
Leaf photosynthesis is usually measured as net CO₂ uptake with an infrared gas analyzer attached to a clamp-on leaf chamber. When light is varied at constant CO₂ and temperature, net photosynthesis traces a characteristic light-response curve. In darkness, net assimilation is negative, equal to the rate of respiration. As light increases, net assimilation rises linearly at first; the slope of this initial region is the apparent quantum yield, the moles of CO₂ fixed per mole of photons absorbed. The light level at which net assimilation is zero is the light compensation point, typically 10 to 40 µmol m⁻² s⁻¹ for sun leaves and lower for shade leaves. At high light, the curve bends over and approaches a maximum set by the capacity of the Calvin–Benson cycle and electron transport. A common empirical model is the non-rectangular hyperbola, in which a curvature parameter θ between 0 and 1 controls how sharply the curve bends:
Here \(A_g\) is gross photosynthesis, \(I\) is absorbed photon flux density, \(\phi\) is the quantum yield, \(A_{\max}\) is the light-saturated rate and \(R_d\) is dark respiration. The theoretical maximum quantum yield is about 0.125 mol O₂ per mol photons, because eight photons are needed to move four electrons through both photosystems for each O₂. Measured values for C3 leaves at normal oxygen are lower, around 0.05 to 0.06 mol CO₂ per mol absorbed photons, largely because photorespiration wastes some of the fixed energy (lesson 4).
import numpy as np
from scipy.optimize import curve_fit

def nrh(I, phi, Amax, theta, Rd):
    b = phi * I + Amax
    Ag = (b - np.sqrt(b * b - 4 * theta * phi * I * Amax)) / (2 * theta)
    return Ag - Rd

rng = np.random.default_rng(340)
I = np.array([0, 25, 50, 100, 200, 400, 700, 1000, 1500, 2000], float)
true = dict(phi=0.055, Amax=24.0, theta=0.75, Rd=1.2)
A = nrh(I, **true) + rng.normal(0, 0.35, I.size)    # simulated sun-leaf data, umol m-2 s-1

p, cov = curve_fit(nrh, I, A, p0=[0.05, 20, 0.7, 1], bounds=([0, 0, 0.01, 0], [0.125, 60, 0.999, 5]))
phi, Amax, theta, Rd = p
se = np.sqrt(np.diag(cov))
print(f"quantum yield phi = {phi:.3f} +/- {se[0]:.3f} mol CO2 per mol photons")
print(f"Amax = {Amax:.1f}, theta = {theta:.2f}, Rd = {Rd:.2f} umol m-2 s-1")
# light compensation point: solve A_net = 0
grid = np.linspace(0, 200, 20001)
lcp = grid[np.argmin(abs(nrh(grid, *p)))]
print(f"light compensation point = {lcp:.0f} umol photons m-2 s-1")
print(f"light for 90% of maximum net rate: {grid[0] + np.interp(0.9*(Amax-Rd), nrh(np.linspace(0,3000,30001),*p), np.linspace(0,3000,30001)):.0f}")quantum yield phi = 0.049 +/- 0.004 mol CO2 per mol photons Amax = 23.5, theta = 0.78, Rd = 0.75 umol m-2 s-1 light compensation point = 15 umol photons m-2 s-1 light for 90% of maximum net rate: 1331
The fit recovers the quantum yield and the light-saturated rate well, but the estimate of dark respiration is noticeably off from the value used to simulate the data (1.2), with a correspondingly low compensation point. That is typical: respiration is constrained mainly by the single measurement in darkness and the few points at very low light, so careful studies measure several low-light points or measure respiration separately. The last line shows that the leaf needs well over 1,000 µmol m⁻² s⁻¹ to reach 90 percent of its maximum net rate, more than half of full sunlight. Most leaves in a canopy are shaded for much of the day, which is why canopy photosynthesis keeps rising with light long after the top leaves are saturated.
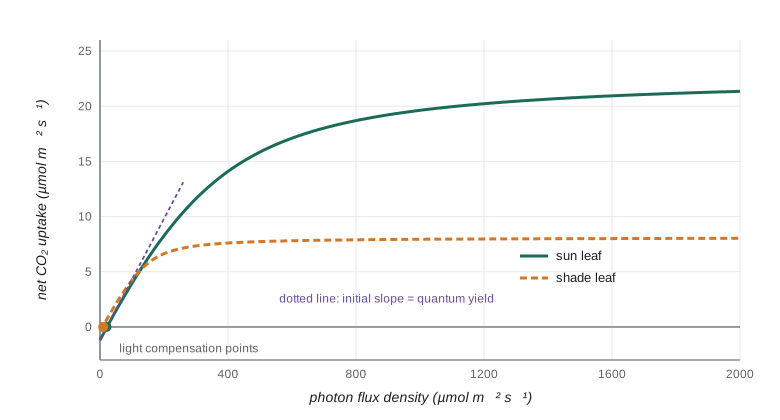
Sun and shade leaves differ in predictable ways. Shade leaves, and leaves of shade-tolerant species such as the sugar maple seedlings of a closed forest floor, have lower dark respiration, lower light compensation points and lower light-saturated rates; they invest in antennae rather than Calvin–Benson enzymes and are thinner, with more leaf area per unit mass. Sun leaves are thicker, with more palisade cells and more rubisco per unit area. The quantum yield, set by the biophysics of the photosystems, is almost the same in both. A shade leaf in full sun is quickly photoinhibited; a sun leaf in deep shade cannot cover its respiration costs. Acclimation to light environment is one of the clearest examples of plasticity in plants.
Herbicides and fluorescence
Several important herbicides act on the light reactions. Triazines such as atrazine and ureas such as diuron (DCMU) bind to the QB site of the D1 protein and block electron flow from photosystem II. Weeds resistant to atrazine often carry a single amino-acid change, serine 264 to glycine, in D1. Bipyridyliums such as paraquat accept electrons from photosystem I and pass them to oxygen, making superoxide that destroys membranes within hours; paraquat is highly toxic to people and its use is restricted or banned in many countries. Researchers also exploit the light reactions as a measuring tool. Chlorophyll fluorescence, the small fraction of absorbed light re-emitted as red light, rises when photochemistry is blocked. The ratio Fv/Fm, measured after dark adaptation, estimates the maximum quantum efficiency of photosystem II and is about 0.83 in healthy leaves of most species; lower values indicate stress or photoinhibition. Portable fluorometers, and satellite measurements of solar-induced fluorescence, now let scientists monitor photosynthesis from single leaves up to whole continents.
Worked problem
Diagnosing a block in electron transport
Isolated thylakoids evolve oxygen in the light when given an artificial electron acceptor that takes electrons from plastoquinol. Adding DCMU stops oxygen evolution. Adding an artificial donor that feeds electrons to plastocyanin, together with an acceptor for ferredoxin, restores electron flow through photosystem I even with DCMU present. Where does DCMU act?
Show solution
- Oxygen evolution depends on electrons leaving photosystem II and reaching the acceptor; DCMU stops it, so DCMU acts at or before plastoquinol.
- Photosystem I still works when supplied with electrons downstream of plastoquinone, so DCMU does not inhibit photosystem I or ferredoxin.
- The block must lie between the photosystem II reaction center and the plastoquinone pool.
- This matches DCMU binding to the QB site of D1, preventing plastoquinone from accepting electrons from QA.
Answer: At the QB site of photosystem II. This kind of experiment, using artificial donors and acceptors to bypass segments of the chain, was how the order of carriers in the Z-scheme was established.
Common mistakes
MistakeSaying that chlorophyll absorbs green light because leaves are green.
InsteadLeaves look green because chlorophyll absorbs green light weakly and reflects or transmits it.
MistakeThinking that the oxygen released in photosynthesis comes from CO₂.
InsteadIsotope labeling shows it comes from water, split by the oxygen-evolving complex of photosystem II.
MistakeExpecting linear electron flow alone to supply the ATP:NADPH ratio the Calvin–Benson cycle needs.
InsteadLinear flow makes too little ATP; cyclic electron flow around photosystem I makes up the shortfall.
MistakeTreating non-photochemical quenching as a sign of damage.
InsteadNPQ is a regulated protective process that dissipates excess energy as heat; damage shows as sustained loss of photosystem II efficiency.
MistakeReading the light-saturated rate as a measure of quantum yield.
InsteadQuantum yield is the initial slope of the light-response curve; the plateau reflects carboxylation and electron transport capacity.
MistakeAssuming both photosystems absorb the same wavelengths equally.
InsteadPhotosystem I uses far-red light that photosystem II cannot, which is the basis of the red drop and the Emerson enhancement effect.
Summary and key terms
- Photon energy is inversely proportional to wavelength; photosynthesis is driven by photon number in the 400–700 nm band.
- Antenna pigments funnel excitation energy by resonance transfer to reaction-center chlorophylls, where charge separation occurs with near-unit efficiency.
- Two photosystems in series (the Z-scheme) lift electrons from water (+0.82 V) to NADP⁺ (−0.32 V); the red drop and Emerson enhancement revealed the two systems.
- The Mn₄CaO₅ cluster cycles through S-states and releases O₂ every fourth photochemical turnover.
- Proton pumping by water splitting and the Q cycle drives ATP synthase; with 14 c subunits, about 4.67 protons are needed per ATP.
- Cyclic electron flow around photosystem I supplies the extra ATP the Calvin–Benson cycle requires.
- Non-photochemical quenching, the xanthophyll cycle, state transitions and D1 repair protect against excess light.
- Light-response curves give the quantum yield, light compensation point and light-saturated rate; sun and shade leaves differ in all but the quantum yield.
- photosynthetically active radiation
- Light between 400 and 700 nm, measured as photon flux density.
- action spectrum
- A graph of how effectively each wavelength drives a biological process.
- antenna complex
- A pigment–protein complex that absorbs light and transfers energy to a reaction center.
- reaction center
- The part of a photosystem where excitation energy drives charge separation.
- Z-scheme
- The model of linear electron flow through photosystems II and I plotted against redox potential.
- oxygen-evolving complex
- The Mn₄CaO₅ cluster of photosystem II that oxidizes water to O₂.
- Q cycle
- The mechanism by which cytochrome b6f pumps extra protons into the lumen as it oxidizes plastoquinol.
- cyclic electron flow
- Electron flow from photosystem I back to the plastoquinone pool that makes ATP without NADPH.
- non-photochemical quenching
- Regulated dissipation of excess absorbed light energy as heat.
- quantum yield
- Moles of product, such as CO₂ fixed or O₂ released, per mole of photons absorbed.
- light compensation point
- The light level at which photosynthetic CO₂ uptake equals respiratory CO₂ release.
- Fv/Fm
- A chlorophyll fluorescence ratio estimating the maximum quantum efficiency of photosystem II.
Practice problems
Work each problem on paper first, then reveal the answer to check.
Calculate the energy of one mole of photons at 600 nm.
Show answer
E = hcN/λ = 6.626e-34 × 2.998e8 × 6.022e23 / 600e-9 ≈ 199 kJ/mol.
What did the red drop and Emerson enhancement effect reveal?
Show answer
That photosynthesis uses two photosystems in series, one of which can use far-red light and one of which cannot.
Why can a single photosystem not move electrons from water to NADP⁺?
Show answer
The potential difference exceeds 1.1 V; with the losses needed for fast, irreversible steps, one photon cannot span it, so two photosystems are used.
In a flash experiment, on which flash does the first large burst of oxygen appear, and why?
Show answer
The third, because most oxygen-evolving complexes rest in S1 in the dark and need three more oxidations to reach S4.
How many protons are needed per ATP if the c-ring has 15 subunits?
Show answer
15/3 = 5 protons per ATP.
Why is cyclic electron flow necessary?
Show answer
Linear flow produces too little ATP relative to NADPH for the Calvin–Benson cycle; cyclic flow adds ATP without NADPH.
What triggers non-photochemical quenching?
Show answer
Acidification of the thylakoid lumen, sensed by PsbS and driving conversion of violaxanthin to zeaxanthin.
A leaf has dark respiration 1.0 and quantum yield 0.05 mol per mol. Estimate its light compensation point.
Show answer
Roughly Rd/φ = 1.0/0.05 = 20 µmol photons m⁻² s⁻¹.
How do shade leaves differ from sun leaves in their light-response curves?
Show answer
Lower dark respiration, lower compensation point and lower light-saturated rate, with a similar quantum yield.
Where does atrazine act, and how do weeds become resistant?
Show answer
At the QB site of D1 in photosystem II; resistance often comes from a serine-264-to-glycine substitution in D1.
Lesson quiz · 5 questions
Score 60% or more to complete this lesson.
Create a free account to save your progress, take quizzes and earn a certificate.