
ARCH-350 · Lesson 2 of 12 · 21 min
Operational energy
Reinholt brings a stack of utility bills to the second session. They belong to the community hub, or rather to a real library and community building of similar size in north Minneapolis that a colleague has lent him for teaching. Twelve months of electricity and twelve months of natural gas, totaled and divided by floor area, give one number. 'This is the most important figure in operational sustainability,' he says, 'and most architects never see it for their own buildings. You will design the hub to a target, and then, if you are lucky and persistent, you will see what it really uses.' This lesson is about operational energy: what it is, how to measure it, how to reduce it, and how to turn it into carbon.
Energy use intensity
Energy use intensity (EUI) is a building's annual energy use divided by its floor area. In the United States it is usually expressed in thousands of British thermal units per square foot per year (kBtu/ft²). It allows buildings of different sizes to be compared, and it is the basis of benchmarking: comparing a building with others of the same type and climate. Site EUI counts the energy delivered to the building; source EUI also counts the energy lost in generating and delivering it, which penalizes electricity from inefficient power plants.
Typical EUIs vary widely by building type. A typical existing office building in the United States uses perhaps 60 to 90 kBtu/ft², a school 50 to 75, a library or community building 70 to 95; a Passive House building may use under 30 in total. The hub's target from Environmental Systems I was 20.6 kBtu/ft², and Ingrid's design reached about 19.7. That is roughly a quarter of a typical existing building of its kind.
Benchmarking tools make the comparison practical. The ENERGY STAR Portfolio Manager, run by the United States Environmental Protection Agency and adapted for Canada by Natural Resources Canada, lets owners enter their bills and compare their building with national data for its type. Minneapolis requires large commercial and multifamily buildings to report their energy use each year, and its scores are public. Federal funding for ENERGY STAR was in doubt in 2025, when the administration proposed ending the program, but Congress kept it funded for the 2026 fiscal year.
Where the energy goes
An EUI is a total. To reduce it, the designer must know its parts. End-use breakdown divides a building's energy into heating, cooling, ventilation fans, domestic hot water, lighting, plug and process loads, pumps and other uses. In an old building in a cold climate, space heating usually dominates. In a well-insulated building, heating shrinks and the plug loads, the computers, kitchen equipment, servers and appliances that the architect does not choose, become the largest single use.
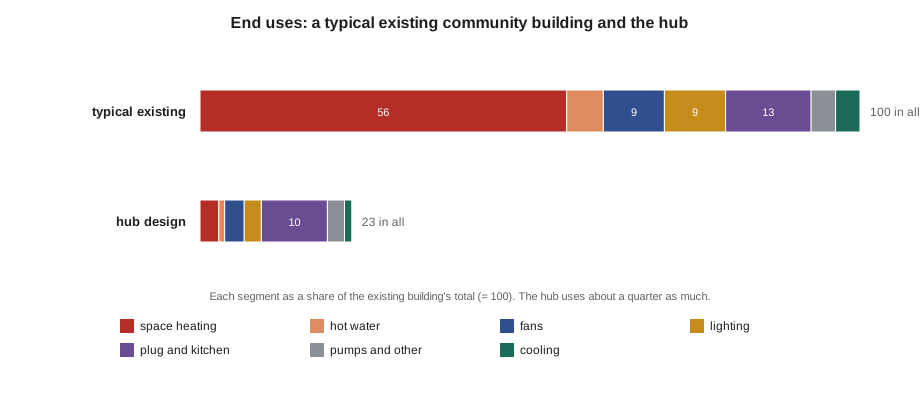
Plug loads deserve attention precisely because architects tend to ignore them. The hub's kitchen, its library computers, its daycare laundry and the hall's audio-visual system together use more energy than its heating. Design can still influence them: by providing a server room that can be cooled efficiently, by specifying efficient kitchen equipment in the owner's brief, by placing timers and occupancy controls on circuits, and by giving staff clear feedback on what the building uses.
The energy hierarchy
Reinholt teaches a simple order of priorities, often called the energy hierarchy or the trias energetica, a term coined at Delft University of Technology in the 1990s.
- First, reduce demand: orientation, compact form, insulation, airtightness, good windows, shading, daylight and natural ventilation, the passive strategies of Environmental Systems I. Demand avoided costs nothing to supply.
- Second, supply the remaining demand efficiently: heat pumps, heat recovery ventilation, efficient fans and lighting, and good controls.
- Third, supply what is left from renewable sources, on site where possible and off site otherwise.
The order matters because each step makes the next one easier. A building with low demand needs smaller, cheaper systems and fewer solar panels. A building that starts with solar panels and skips the envelope may produce energy, but it will still lose most of it through its walls, and the envelope will last much longer than the panels.
Electrification and heat pumps
The single most important shift in operational carbon is electrification: replacing equipment that burns fuel on site with equipment that runs on electricity. Heat pumps are central to it. A heat pump moves heat from outdoor air, the ground or exhaust air into the building, delivering two to four units of heat for each unit of electricity, depending on the temperatures. Cold-climate air-source heat pumps now operate down to about −13 to −22 °F, though their efficiency falls in the coldest weather, so designs in Minneapolis often include ground-source systems, electric backup or thermal storage.
Electrification has costs and complications. Heat pumps need more space and more careful design than boilers. Their refrigerants are potent greenhouse gases: R-410A, common until recently, has a global warming potential of about 2,000 times that of carbon dioxide, and the newer refrigerants R-32 and R-454B, now required for new equipment under federal rules since 2025, are still several hundred times as potent. Leaks during operation and at the end of a system's life can add substantially to operational carbon. Good practice includes low-charge systems, leak detection and responsible recovery.
Electrification also changes the shape of electricity demand. A heat pump building's peak load comes on the coldest winter evenings, when the grid is also strained. Thermal mass, good envelopes and storage reduce that peak, and they matter as much to the utility as to the owner.
From energy to carbon
Lesson 1 showed that emissions equal energy times an emission factor. For operational carbon, the designer must choose which factor to use. An average factor represents the whole grid's emissions divided by all its generation over a year. A marginal factor represents the emissions of the power plants that respond when demand rises or falls, which are usually fossil plants. Hourly factors capture how the grid changes over a day and a year. Average annual factors are the simplest and are used in most codes and rating systems; marginal and hourly factors give a truer picture of what a design decision actually changes.
Reinholt asks Ingrid to compare the hub as designed, all-electric with heat pumps, against a version with the same envelope but a gas boiler for heating and hot water.
# Community hub: end uses and operational emissions, all-electric versus gas boiler
AREA = 27232                    # gross floor area, ft2
# delivered end uses per ft2 of floor area, in kBtu per year (from the hub's energy model)
heat_demand = 6.34               # space heating delivered to rooms
dhw_demand = 1.9                # domestic hot water
electric = {"plug and kitchen": 8.56, "ventilation fans": 2.54, "lighting": 2.22,
            "pumps and other": 2.22, "cooling": 0.95}
COP_HEAT, COP_DHW = 2.6, 2.5     # seasonal heat pump efficiencies
EFF_BOILER, EFF_WH = 0.90, 0.85  # gas boiler and gas water heater efficiencies
EF_ELEC = 0.126                  # kg CO2e per kBtu of electricity
EF_GAS = 0.053                   # kg CO2e per kBtu of gas burned

other = sum(electric.values())
eui_hp = other + heat_demand / COP_HEAT + dhw_demand / COP_DHW
gas = heat_demand / EFF_BOILER + dhw_demand / EFF_WH
eui_gas = other + gas
co2_hp = eui_hp * AREA * EF_ELEC
co2_gas = (other * EF_ELEC + gas * EF_GAS) * AREA
print(f"all-electric hub: EUI {eui_hp:5.1f} kBtu per ft2, {co2_hp / 1000:7.2f} t CO2e per year")
print(f"gas boiler hub:   EUI {eui_gas:5.1f} kBtu per ft2, {co2_gas / 1000:7.2f} t CO2e per year")
for name, v in sorted(electric.items(), key=lambda kv: -kv[1]):
    print(f"  {name:18s} {v / eui_hp * 100:4.0f}% of the all-electric total")
print(f" heating and hot water {(heat_demand / COP_HEAT + dhw_demand / COP_DHW) / eui_hp * 100:4.0f}%")all-electric hub: EUI 19.7 kBtu per ft2, 67.56 t CO2e per year gas boiler hub: EUI 25.8 kBtu per ft2, 69.97 t CO2e per year plug and kitchen 43% of the all-electric total ventilation fans 13% of the all-electric total lighting 11% of the all-electric total pumps and other 11% of the all-electric total cooling 5% of the all-electric total heating and hot water 16%
On today's Minnesota grid the all-electric hub emits about 68 metric tons a year and the gas version about 70: almost the same, because all of the hub's electricity, not only the heat pumps', still comes partly from fossil plants. But the gas version's emissions stay roughly fixed for the boiler's thirty-year life, while the electric version's fall toward zero as the grid meets the 2040 carbon-free requirement. In both cities, plug and kitchen loads are now the largest single end use of the all-electric hub, larger than heating.
Gas emission factors deserve a caution. The figures above count only the carbon dioxide from burning gas. Methane leaks from wells, pipelines and building connections add to the true climate effect, and studies suggest that in some systems the leaks add a substantial fraction to the combustion figure. Methane is a powerful short-lived greenhouse gas, so these leaks matter most in the next few decades.
Codes, targets and the performance gap
Energy codes set the floor. Minnesota's 2024 commercial energy code, in force since January 2024, is based on ASHRAE 90.1-2019. State-funded projects must also meet the SB 2030 energy standard, which sets steadily falling energy and carbon targets relative to a 2003 baseline, reaching net-zero carbon in 2030. Voluntary standards, rating systems and owner requirements set higher targets; Lesson 9 compares them.
The performance gap is the difference between what a building was designed to use and what it actually uses. Studies in many countries have found measured energy use well above predictions, sometimes by half or more. The causes include optimistic modeling assumptions, construction defects such as gaps in insulation or air barriers, systems that are never properly commissioned, controls that are overridden, and occupants who use the building differently from the model. Closing the gap requires realistic models, careful construction, commissioning, metering and feedback. Reinholt calls it the most important unsolved problem in green building: 'A building is only as green as its meter says.'
Worked problem
Choosing a heating system for the hub
Priyanka Sethi, the energy modeler who worked on the hub in Environmental Systems I, joins the review. Callum argues that a gas boiler would be cheaper to install and that the hub's demand is so low that its emissions hardly matter. How should the team decide?
Show solution
- Compare the operational emissions with the local emission factors, now and over the system's life, including expected grid changes.
- On the Minnesota grid, the gas boiler emits only slightly more today, but its emissions are fixed for thirty years while the heat pumps' emissions fall with the grid toward zero by 2040.
- Include refrigerant leakage in the heat pump option: specify a low-GWP refrigerant, a low-charge system and leak monitoring.
- Compare life cycle cost, not only first cost: gas prices and carbon charges, maintenance, and the cost of replacing the boiler early if future rules require it.
- Consider peak demand: the hub's thermal mass and envelope keep its winter peak low, which makes heat pumps easier to supply.
Answer: Sethi recommends heat pumps with a small electric backup. Callum accepts the argument but asks for the life cycle cost comparison to be included in the client report, so the board sees the full picture.
Exercise 2: energy and carbon of the hub
- Using the hub's energy model, prepare an end-use breakdown and identify the three largest uses.
- Propose one design measure for each of the three that would reduce it, and estimate the saving.
- Calculate operational emissions with average annual emission factors for your city, and discuss how marginal or hourly factors might change the result.
- Write a short commissioning and metering plan that would let the owner compare actual use with the model after the first year.
Self-critique checklist
- Have I followed the energy hierarchy, reducing demand before adding renewables?
- Have I included plug loads and refrigerant leakage?
- Have I stated which emission factors I used and why?
- Have I planned how to close the performance gap?
Common mistakes
MistakeComparing EUIs without saying site or source energy.
InsteadState which, and compare like with like.
MistakeIgnoring plug loads because the architect does not choose them.
InsteadPlan for them in the brief, the electrical design and the controls.
MistakeAdding solar panels before improving the envelope.
InsteadReduce demand first; the envelope outlasts the panels.
MistakeTreating heat pumps as zero carbon.
InsteadCount their electricity with local factors and include refrigerant leaks.
MistakeAssuming the building will perform as modeled.
InsteadCommission it, meter it and compare actual use with the design.
Summary and key terms
- Energy use intensity is annual energy divided by floor area; it allows benchmarking against similar buildings.
- End-use breakdown shows where energy goes; in efficient buildings, plug loads often exceed heating.
- The energy hierarchy is to reduce demand, supply it efficiently, then supply it renewably.
- Electrification with heat pumps is central to cutting operational carbon, but refrigerants and peak demand need care.
- Average, marginal and hourly emission factors answer different questions; gas emissions also include methane leaks.
- The performance gap between design and reality is closed by realistic models, careful construction, commissioning and metering.
- EUI
- Energy use intensity: annual energy use divided by floor area.
- Site energy
- Energy delivered to the building, as metered.
- Source energy
- Site energy plus the losses in generating and delivering it.
- End-use breakdown
- Division of energy use into heating, cooling, fans, hot water, lighting, plug loads and other uses.
- Plug loads
- Energy used by equipment plugged into outlets, such as computers and appliances.
- Electrification
- Replacing on-site fuel combustion with equipment that runs on electricity.
- Marginal emission factor
- Emissions of the power plants that respond to a change in demand.
- Performance gap
- The difference between a building's designed and actual energy use.
Practice problems
Work each problem on paper first, then reveal the answer to check.
A building of 43,000 ft² uses 1,640,000 kBtu a year. What is its EUI?
Show answer
1,640,000 ÷ 43,000 = 38 kBtu/ft².
A heat pump with a seasonal coefficient of performance of 3 supplies 205,000 kBtu of heat. How much electricity does it use?
Show answer
205,000 ÷ 3 = 68,300 kBtu, about 20,000 kWh.
Why do plug loads become the largest end use in efficient buildings?
Show answer
Insulation, airtightness and heat recovery shrink heating, while equipment loads, which the envelope does not affect, stay much the same.
What is the difference between an average and a marginal emission factor?
Show answer
The average factor is the grid's total emissions divided by its generation; the marginal factor is the emissions of the plants that respond to a change in demand, usually fossil plants.
Give three causes of the performance gap.
Show answer
Any three of: optimistic modeling assumptions, construction defects, poor commissioning, overridden controls, and occupants using the building differently from the model.
Lesson quiz · 5 questions
Score 60% or more to complete this lesson.
Create a free account to save your progress, take quizzes and earn a certificate.