
ARCH-110 · Lesson 8 of 12 · 20 min
Diagrams
At the midterm review, a visiting critic looks at Joon-ho's wall of drawings for the boathouse: plans, sections, elevations, two perspectives, all carefully made. 'These are good,' she says, 'but what is the idea?' Joon-ho talks for two minutes about the river, the morning light, the path and the way people gather to launch canoes. The critic nods and hands him a marker. 'Draw that. Not the building. The idea.' He draws a line for the path, an arrow sweeping down to the water, a circle where people gather and a wedge of morning sun coming across the river. The critic taps it. 'Now I understand all your other drawings.'
What a diagram is
A diagram is a drawing that shows relationships rather than appearance. Where a plan shows exactly where every wall is, a diagram shows why: which spaces need to be near each other, how people move, where the light comes from, what the structure does, how the building sits in its surroundings. A good diagram leaves out almost everything, so that one idea is unmistakable. Architects use diagrams to analyze sites and precedents, to generate designs and to explain them to others.
Diagrams are abstract. They use simple shapes, such as circles, rectangles, lines and arrows, and a small number of tones or colors, each with a clear meaning. They are often drawn quickly, but the best are refined carefully, because every mark carries meaning. The architect and theorist Christopher Alexander, in his 1964 book Notes on the Synthesis of Form, argued that design problems can be broken down into sets of related requirements and represented as diagrams; architects since have argued for and against diagrams as generators of form, but no one disputes their power to explain.
Kinds of diagram
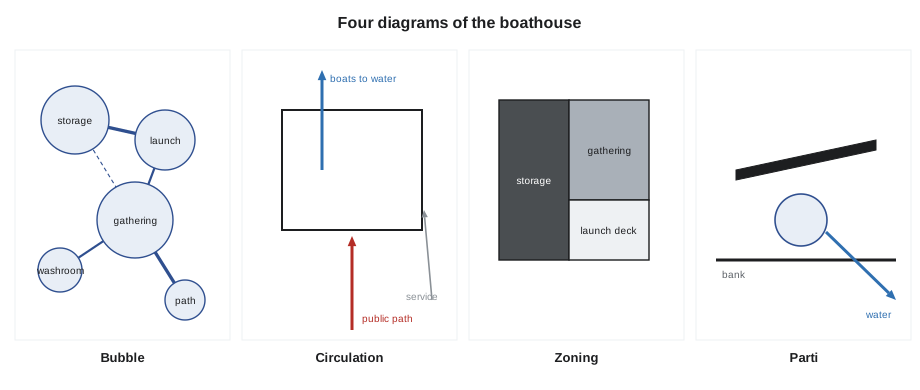
- Bubble diagram: spaces drawn as circles or loose shapes, sized roughly by area, with lines between those that must be connected. It is used early in design to explore arrangements before any walls are drawn.
- Adjacency matrix: a table listing all spaces along both axes, with each cell marking how strongly two spaces should be connected, such as essential, desirable or not needed. It is the analytic partner of the bubble diagram.
- Circulation diagram: arrows and lines showing how people, vehicles, goods or services move through and around a building, often with separate tones for public, private and service routes.
- Zoning diagram: areas of a plan or section toned by use, such as public, private, service or wet and dry, or by environmental condition such as heated and unheated.
- Massing diagram: simple volumes showing the main parts of a building and how they relate, usually in axonometric.
- Structural diagram: the main load paths, columns, walls and spans, stripped of everything else.
- Environmental diagram: sun paths, winds, views, noise, daylight and ventilation.
- Parti: the single central idea of a design, captured in a very simple drawing; from the French prendre parti, to make a decision.
Bubble diagrams and adjacency
The bubble diagram is often the first drawing of a design. Begin with a list of spaces and their approximate areas, the program, and draw each as a bubble roughly proportional to its area. Connect bubbles that must be next to each other with a heavy line, those that should be near with a lighter line. Then rearrange: draw the bubbles on the site, move them so that connected ones touch, place the ones that need sun or views on the right sides and the service spaces where deliveries arrive. Several arrangements on one page let you compare options quickly.
# Adjacency matrix: score how well a layout keeps related spaces next to each other
spaces = ["storage", "launch", "gathering", "washroom", "path"]
need = {("storage", "launch"): 3, ("gathering", "launch"): 2, ("gathering", "path"): 3,
        ("washroom", "gathering"): 2, ("storage", "path"): 1}      # 3 essential, 2 desirable, 1 useful
layout = {"storage": (0, 0), "launch": (1, 0), "gathering": (1, 1), "washroom": (2, 1), "path": (1, 2)}
def adjacent(a, b):
    (x1, y1), (x2, y2) = layout[a], layout[b]
    return abs(x1 - x2) + abs(y1 - y2) == 1                     # side by side on the grid
score = sum(w for (a, b), w in need.items() if adjacent(a, b))
best = sum(need.values())
print(f"layout scores {score} of {best}")
for (a, b), w in need.items():
print(f" {a:9s} - {b:9s} weight {w}: {'adjacent' if adjacent(a, b) else 'apart'}")layout scores 10 of 11 storage - launch weight 3: adjacent gathering - launch weight 2: adjacent gathering - path weight 3: adjacent washroom - gathering weight 2: adjacent storage - path weight 1: apart
The script turns an adjacency matrix into a score. Each pair of spaces carries a weight for how much it matters that they touch, and a layout on a simple grid earns the weight for each pair it puts side by side. Try moving the washroom or the storage and rerun it. Real design involves far more than adjacency, but scoring options this way is a useful discipline, and it is the seed of the computational layout methods that some offices use for large, complex buildings.
Figure-ground
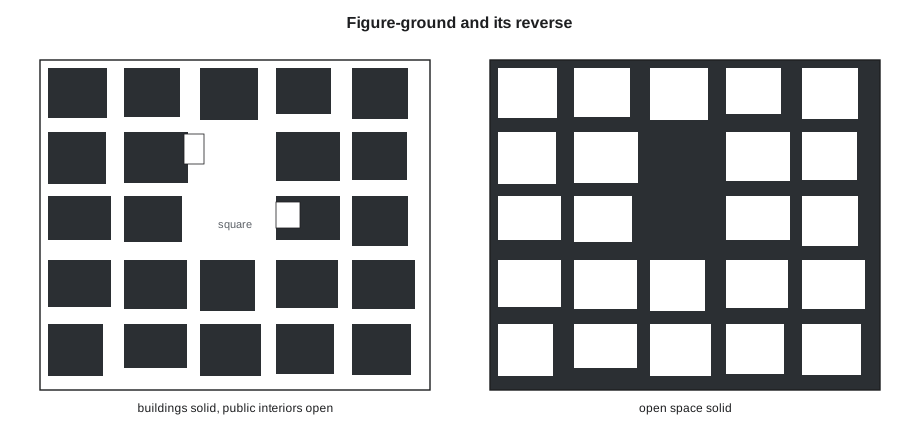
A figure-ground drawing shows buildings as solid black shapes on a white ground, or the reverse, with everything else removed. It reveals the pattern of a city or a site: how dense it is, how streets and squares are shaped, whether open space is the leftover between buildings or a figure in its own right. The most famous example is the plan of Rome made by Giambattista Nolli in 1748, which showed buildings in dark tone but left the interiors of churches and other public spaces white, as if they were continuous with the streets and squares. The Nolli map shows public space as one connected system running through the city, indoors and out.
Figure-ground analysis is a standard first step in any urban or site project. Draw the site and its surroundings at 1 in = 100 ft or 1 in = 200 ft, fill every building solid and look at the pattern. Then draw the reverse, with the open space solid, and look again. In a traditional city the open spaces read as shapes; in a suburb they read as an undifferentiated background. At Kestrel Point, the figure-ground shows a few scattered buildings in a large open landscape, which tells you that the boathouse will be read as an object in a field rather than as part of a street.
Exploded and analytic diagrams
Diagrams can be three-dimensional. An exploded axonometric diagram, like the exploded drawings you made in lesson 5 but more abstract, separates a building into systems, such as structure, enclosure, circulation and services, each drawn in its own tone, so that their relationships are clear. Analytic diagrams of precedents strip a building to one idea at a time: its geometry, its structure, its circulation, its light. Drawing a series of analytic diagrams of a building you admire, for example the Barcelona Pavilion by Ludwig Mies van der Rohe of 1929, with its freestanding planes and steel columns, teaches more about it than any photograph.
Graphic rules for diagrams
A diagram works when it is simple and consistent. Use few elements and few tones. Give each tone or line type one meaning, and keep it throughout a set of diagrams, so that if public circulation is a heavy red arrow in one diagram it is a heavy red arrow in all of them. Use arrows with clear heads, solid for primary movement and dashed for secondary. Label directly on the diagram rather than with a key when you can. Draw a series of diagrams at the same scale and orientation, side by side, so that each adds one layer of the story. And always ask: what is the one thing this diagram must show? If you cannot say it in a sentence, the diagram is not ready.
Diagrams can mislead as easily as they explain. A diagram that shows a building catching all the sun, or connecting perfectly to the city, may simply have left out the facts that contradict it. Make diagrams honest: base them on real site data, real dimensions and real orientations, and check them against the full drawings.
Worked problem
Scoring two layouts
Callum has two layouts for the boathouse on a three-by-three grid. In layout A, storage is next to launch and launch next to gathering, gathering is next to the path and the washroom, but storage is not next to the path. In layout B, storage is next to the path and launch, gathering is next to launch, but the washroom is not next to gathering and gathering is not next to the path. Using the weights in the script, which layout scores higher?
Show solution
- Layout A: storage-launch 3 + gathering-launch 2 + gathering-path 3 + washroom-gathering 2 = 10, missing storage-path 1.
- Layout B: storage-launch 3 + storage-path 1 + gathering-launch 2 = 6, missing gathering-path 3 and washroom-gathering 2.
- Layout A scores 10 of 11; layout B scores 6 of 11.
Answer: Layout A is much better: it keeps the essential gathering-path connection. The score helps the comparison, but Callum should still sketch both and look at sun, views and the slope before deciding.
Exercise 8: a diagram set
This exercise takes about five hours.
- Write the program for the boathouse or your own project, with areas, and draw an adjacency matrix.
- Draw three alternative bubble diagrams on the site, and score them with the script.
- Draw a figure-ground of the site and its surroundings, and its reverse.
- Draw a set of four diagrams of your chosen design at the same scale and orientation: circulation, zoning, structure and sun.
- Draw a parti diagram that captures the central idea in no more than five lines or shapes.
- Deliverable: one sheet with all the diagrams and a one-sentence caption under each stating what it shows.
Self-critique checklist
- Does each diagram show one idea clearly?
- Does each tone or line type mean the same thing in every diagram?
- Are the diagrams at the same scale and orientation?
- Is each diagram honest, based on real data?
- Can I say the idea of the parti in one sentence?
Diagrams in the review
At a review, diagrams usually come first on the wall or in the slide sequence, because they tell the jury what to look for in everything that follows. A strong opening is a site diagram that states the main condition, such as the bank, the river and the morning sun at Kestrel Point, followed by the parti and then two or three system diagrams. Only then come the plans, sections and perspectives, which the jury can now read as evidence for the idea rather than as a puzzle to be solved. Joon-ho reorganizes his wall this way for the final review, and the discussion moves straight to the quality of the design instead of what it is.
Diagrams are also a design tool after the review. When a critic suggests a change, test it first as a diagram: redraw the circulation with the entry moved, or the zoning with the washroom on the other side, and see whether the main idea survives. If the parti still holds, the change is a refinement; if the parti breaks, the change is a new design, and you should decide deliberately whether you want it. Keep your diagrams up to date as the project develops, so that they always describe the building you are actually drawing.
One more test applies to every diagram: show it to someone who has not seen the project and ask them what it says. If they describe the idea you intended, the diagram works. If they describe something else, or ask what the arrows mean, simplify it. Ingrid tries her circulation diagram on her roommate, who reads the dashed service route as a river; a change of color and a one-word label fixes it.
Common mistakes
MistakePutting too much information in one diagram.
InsteadShow one idea per diagram and use a series for several ideas.
MistakeChanging the meaning of colors or line types between diagrams.
InsteadKeep a consistent graphic language across the set.
MistakeDrawing a diagram that contradicts the site facts.
InsteadBase diagrams on real orientations, dimensions and data.
MistakeTreating a bubble diagram as a floor plan.
InsteadBubbles show relationships; walls and sizes come later.
Summary and key terms
- A diagram shows relationships rather than appearance, leaving out almost everything except one idea.
- Bubble diagrams and adjacency matrices explore which spaces must connect.
- Circulation, zoning, massing, structural and environmental diagrams each isolate one system.
- Figure-ground drawings reveal the pattern of solid and open space; the Nolli map of 1748 is the classic example.
- Good diagrams are simple, consistent, honest and drawn in sets at the same scale and orientation.
- Diagram
- A drawing that shows relationships rather than appearance.
- Bubble diagram
- A diagram of spaces as bubbles linked by lines showing connections.
- Adjacency matrix
- A table rating how strongly each pair of spaces should connect.
- Figure-ground
- A drawing of buildings as solid shapes on an open ground, or the reverse.
- Parti
- The central organizing idea of a design, shown in a very simple drawing.
Practice problems
Work each problem on paper first, then reveal the answer to check.
What does a bubble diagram show?
Show answer
Spaces and the connections between them, before walls are drawn.
What was special about the Nolli map of Rome?
Show answer
Public interiors such as churches were left white, continuous with streets and squares.
Why draw a series of diagrams at the same scale and orientation?
Show answer
So each adds one layer and they can be compared.
What does parti mean?
Show answer
The central idea of a design, from the French for making a decision.
How can a diagram mislead?
Show answer
By leaving out facts that contradict the idea it shows.
Lesson quiz · 5 questions
Score 60% or more to complete this lesson.
Create a free account to save your progress, take quizzes and earn a certificate.