
SLS-222 · Lesson 3 of 12 · 23 min
Reading a customer's financial statements
▶ Video coming soon A video version of this lesson is on the way.
Ridgeline's leasing partner had asked Keystone Grain Equipment for its most recent financial statements, because one option in Maya's training-centre proposal was a five-year lease. Marlene Toews, Keystone's finance director, sent a two-page summary of the 2025 statements and, when Maya asked, agreed that she could use the figures to build the business case, provided they stayed inside Ridgeline. On October 6, Maya brought the two pages to the value desk. "I can read the numbers," she said. "I just don't know what they're telling me."
Grace Liu took the session. "You don't need to audit them," she said. "You need to answer four questions. How big is this business? Is it making money? Can it pay its bills? And what does its year look like? Ten minutes with two pages will answer all four."
All of Keystone's figures in this lesson are fictional and simplified, as are all of Ridgeline's customers. Real financial statements include many more lines and notes, but the structure is the same.
The statements and the rules behind them
Most organizations prepare three main financial statements. The income statement shows revenue, expenses and profit over a period, usually a year. The balance sheet shows what the organization owns (its assets), what it owes (its liabilities) and the owners' stake (equity) at a single date. The cash flow statement shows where cash came from and where it went during the period. Notes to the statements explain the accounting choices and add detail.
In Canada, the rules a company follows depend on what kind of company it is. Public companies, whose shares trade on a stock exchange, use International Financial Reporting Standards (IFRS), which call the income statement a statement of profit or loss and the balance sheet a statement of financial position. Most private companies, like Keystone, use Accounting Standards for Private Enterprises (ASPE), which keep the familiar names income statement and balance sheet. Public companies' statements are free to read on SEDAR+, the national filing system run by the Canadian Securities Administrators. Private companies do not publish theirs, so a seller sees them only when the customer chooses to share them.
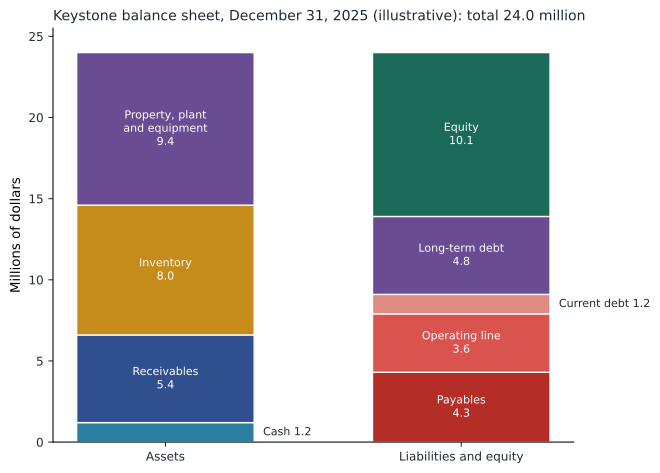
Whatever the rules, the basic relationship on the balance sheet always holds:
Keystone's income statement
| Keystone Grain Equipment, year ended December 31, 2025 | Dollars | Per 100 dollars of revenue |
|---|---|---|
| Revenue | 42,000,000 | 100.0 |
| Cost of goods sold | 31,500,000 | 75.0 |
| Gross profit | 10,500,000 | 25.0 |
| Selling, general and administrative expenses | 7,980,000 | 19.0 |
| Operating income | 2,520,000 | 6.0 |
| Interest expense | 420,000 | 1.0 |
| Income before income taxes | 2,100,000 | 5.0 |
| Income taxes | 504,000 | 1.2 |
| Net income | 1,596,000 | 3.8 |
Reading down the statement, Grace pointed out three things. First, Keystone's gross margin was 25 in 100: for every 100 dollars of equipment it sold, 75 dollars went on steel, motors, parts and factory labour. That is typical of an equipment manufacturer and means material prices matter enormously to Keystone. Second, its operating margin was 6 in 100, which Maya had already used in lesson 1. Third, Keystone was profitable but not by a wide margin. A bad year for farmers would squeeze it quickly.
The tax line reflected Keystone's own circumstances. Grace did not try to explain it; tax depends on the company's structure and on federal and provincial rules, and is the customer's accountant's business, not the seller's.
Worked problem
Calculating Keystone's margins
Using Keystone's 2025 income statement, calculate its gross margin, operating margin and net margin.
Show solution
- \[\text{Gross margin} = \frac{10{,}500{,}000}{42{,}000{,}000} = 0.25\]
- \[\text{Operating margin} = \frac{2{,}520{,}000}{42{,}000{,}000} = 0.06\]
- \[\text{Net margin} = \frac{1{,}596{,}000}{42{,}000{,}000} = 0.038\]
Answer: Gross margin 25 in 100, operating margin 6 in 100 and net margin about 3.8 in 100.
Keystone's balance sheet
| Keystone Grain Equipment, December 31, 2025 | Dollars |
|---|---|
| Cash | 1,200,000 |
| Accounts receivable (owed by dealers) | 5,400,000 |
| Inventory | 8,000,000 |
| Total current assets | 14,600,000 |
| Property, plant and equipment, net | 9,400,000 |
| Total assets | 24,000,000 |
| Accounts payable (owed to suppliers) | 4,300,000 |
| Operating line of credit (bank) | 3,600,000 |
| Current portion of long-term debt | 1,200,000 |
| Total current liabilities | 9,100,000 |
| Long-term debt | 4,800,000 |
| Shareholders' equity | 10,100,000 |
| Total liabilities and equity | 24,000,000 |
Current assets are those expected to turn into cash within a year: cash itself, money owed by customers and inventory. Current liabilities are those due within a year. The difference between them is working capital, the cushion a business has to pay its short-term bills.
Four ratios a seller can use
Grace showed Maya four ratios that answer most of a seller's questions. Each is a single division.
| Ratio | How it is calculated | What it tells a seller |
|---|---|---|
| Current ratio | Current assets ÷ current liabilities | Whether the customer can comfortably pay its bills this year |
| Days sales outstanding (DSO) | Accounts receivable ÷ revenue × 365 | How long the customer waits to be paid by its own customers |
| Inventory days | Inventory ÷ cost of goods sold × 365 | How long stock sits before it is sold, and how much cash it ties up |
| Debt to equity | Total interest-bearing debt ÷ equity | How heavily the business relies on borrowing |
Worked problem
Keystone's liquidity and working capital
Using Keystone's balance sheet and income statement, calculate its working capital, current ratio, days sales outstanding, inventory days and debt-to-equity ratio.
Show solution
- \[\text{Working capital} = 14{,}600{,}000 - 9{,}100{,}000 = 5{,}500{,}000\]
- \[\text{Current ratio} = \frac{14{,}600{,}000}{9{,}100{,}000} \approx 1.60\]
- \[\text{DSO} = \frac{5{,}400{,}000}{42{,}000{,}000} \times 365 \approx 47 \text{ days}\]
- \[\text{Inventory days} = \frac{8{,}000{,}000}{31{,}500{,}000} \times 365 \approx 93 \text{ days}\]
- Interest-bearing debt: 3,600,000 + 1,200,000 + 4,800,000 = 9,600,000 dollars.
- \[\text{Debt to equity} = \frac{9{,}600{,}000}{10{,}100{,}000} \approx 0.95\]
Answer: Keystone has 5.5 million dollars of working capital and a current ratio of about 1.6. It waits about 47 days to be paid by dealers, holds about 93 days of inventory and has slightly less debt than equity. It is sound but carries a lot of cash in inventory and receivables, and it relies on its bank line.
A current ratio of 1.6 means Keystone has 1.60 dollars of short-term assets for every dollar of short-term bills. That is comfortable for a manufacturer, but much of those assets is inventory, which cannot pay a bill until it is sold. A stricter test leaves inventory out: cash plus receivables, 6.6 million dollars, divided by current liabilities of 9.1 million gives about 0.73. Keystone depends on selling its stock and collecting from dealers, and in the meantime on its operating line.
What a year-end snapshot hides
A balance sheet is a photograph at one date. Keystone's year ends on December 31, when its inventory is building for spring and its shipping season is long over. Marlene had added a note in the margin of her summary: the operating line was usually close to its limit by March, and dealers paid most of their accounts between June and October. Combined with the shipping pattern Dale had described, roughly ten shipments a month from April to July, fifteen in August and September and five in the other months, that told Maya more about Keystone's cash than any ratio.
| Months | What is happening at Keystone | What it means for a seller |
|---|---|---|
| January to March | Building inventory; borrowing on the operating line; board meets in January | Cash is tight; large payments are unwelcome; capital decisions are made for the year |
| April to July | Shipping season begins; receivables rise | Staff are busiest; installation and training are hard to schedule |
| August and September | Peak shipping | The worst time for disruption on site |
| October to December | Dealers pay; the line is repaid; planning for next year | Cash is strongest; budgets for next year are being set |
Maya changed two things in her proposal as a result. She moved the installation of the training centre to the quiet weeks of early winter, which Dale had already preferred, and she added a lease option so that Keystone would not have to find 48,000 dollars in cash at the start of its tightest period. Lesson 5 compares the lease and the purchase.
Using financial information responsibly
Financial statements shared by a private customer are confidential. Maya stored Keystone's summary in the CRM's restricted documents folder, used the figures only for the business case and the leasing application, and did not mention them to anyone outside the account team. Rob's rule was simple: never quote a customer's own numbers back to anyone but the customer, and never let them appear in a reference story or a case study without written permission.
There is also a question of tone. Few things irritate an owner more than a salesperson explaining his own business to him. Grace's advice was to use the statements to ask better questions rather than to make pronouncements. "I see your inventory peaks in the spring. How does that affect when you'd want to pay for a project like this?" is a question that shows understanding. "Your current ratio suggests you can afford this" is a statement that invites the reply "That's for us to decide."
For public companies and public bodies, the same thinking applies to information anyone can read. A school division's audited statements and budget, a city's capital plan or a listed company's annual report are fair sources, and reading them before a meeting is one of the simplest ways to show business acumen.
The cash flow statement
Marlene's summary did not include a cash flow statement, and Grace explained why it would have been worth asking for. The income statement records revenue when a sale is made and expenses when they are incurred, not when money moves. The cash flow statement shows the actual movement of cash in three groups: operating activities (cash from running the business), investing activities (buying or selling equipment, buildings and other long-term assets) and financing activities (borrowing, repaying loans and paying owners).
A simple example shows why profit and cash can differ so much. Suppose a business earns 1.6 million dollars of net income in a year, but during the same year its receivables grow by 900,000 dollars because dealers are paying more slowly, and its inventory grows by 1.1 million dollars because it is building stock for a larger season. Cash from operations is then roughly the profit, plus any non-cash expenses such as depreciation, minus the cash that has been absorbed into receivables and inventory.
Worked problem
Why a profitable year can still be short of cash
A manufacturer reports net income of 1,600,000 dollars. Its depreciation expense, which reduced profit but involved no cash payment, was 700,000 dollars. During the year, accounts receivable rose by 900,000 dollars and inventory rose by 1,100,000 dollars. Accounts payable rose by 300,000 dollars. Ignoring other items, what was its cash flow from operating activities?
Show solution
- Start with net income: 1,600,000 dollars.
- Add back depreciation, a non-cash expense: + 700,000.
- Subtract the increase in receivables, cash not yet collected: − 900,000.
- Subtract the increase in inventory, cash spent on stock not yet sold: − 1,100,000.
- Add the increase in payables, bills not yet paid: + 300,000.
- \[1{,}600{,}000 + 700{,}000 - 900{,}000 - 1{,}100{,}000 + 300{,}000 = 600{,}000\]
Answer: Operating cash flow was about 600,000 dollars, well under half of net income. A seller who assumed the company had 1.6 million dollars of spare cash would misjudge how it feels about a large up-front payment.
For a seller, the lesson is not to calculate cash flow but to remember that a customer's willingness to pay, and its preference for when to pay, depend on cash, not on profit. A company growing quickly is often short of cash for exactly this reason.
Questions to ask a finance director
Financial statements tell a seller where to look; conversations fill in the picture. Grace's list of questions for a first meeting with a finance director was short, and none of them asked for confidential figures.
- "How will a decision like this be evaluated here: payback, return on investment, budget fit, or something else?"
- "Is this a capital purchase or an operating expense in your budget, and does that make a difference to who approves it?"
- "What hurdle or minimum return do projects normally need to clear?"
- "Are there times of year when payments are harder or easier for you?"
- "Would leasing or spreading the cost be useful, or do you prefer to buy outright?"
- "What would you need to see to be confident in the savings?"
Marlene answered most of these in a fifteen-minute call. Keystone judged equipment purchases mainly on payback, looked for payback within three years, treated anything over 20,000 dollars as a capital purchase needing the owners' board, and preferred not to make large payments between January and April. Each answer shaped the proposal more than any feature did.
Common mistakes
MistakeA profitable company always has plenty of cash.
InsteadProfit and cash differ; a growing or seasonal business can be profitable and short of cash because cash is tied up in inventory and receivables.
MistakeA current ratio above 1 means the customer can pay any bill at any time.
InsteadMuch of current assets may be inventory; the quick test without inventory and the timing of the customer's year matter too.
MistakeA year-end balance sheet shows the customer's typical position.
InsteadIt is a snapshot on one date; seasonal businesses look very different at other times of year.
MistakeQuoting the customer's ratios to the owner shows expertise.
InsteadUse the figures to ask better questions; owners resent being told about their own business.
Summary and key terms
- Financial statements answer four questions: how big the business is, whether it makes money, whether it can pay its bills, and what its year looks like.
- The income statement shows revenue, costs and profit over a period; the balance sheet shows assets, liabilities and equity at a date; the cash flow statement shows cash movements.
- Rules differ by country: IFRS for public companies and ASPE for most private companies in Canada.
- Gross, operating and net margins show profitability.
- Working capital, the current ratio, days sales outstanding, inventory days and debt to equity show liquidity and financing.
- A year-end snapshot hides seasonal patterns, which matter for timing and payment terms.
- Customer financial information is confidential and should be used to ask better questions.
- Income statement
- A statement of revenue, expenses and profit over a period.
- Balance sheet
- A statement of assets, liabilities and equity at a single date.
- Working capital
- Current assets minus current liabilities.
- Current ratio
- Current assets divided by current liabilities.
- Days sales outstanding
- Accounts receivable divided by revenue, times 365: the average days to collect from customers.
- Inventory days
- Inventory divided by cost of goods sold, times 365: the average days stock is held.
- Debt to equity
- Interest-bearing debt divided by owners' equity.
- ASPE
- Accounting Standards for Private Enterprises, used by most private companies in Canada.
Practice problems
Work each problem on paper first, then reveal the answer to check.
A company has current assets of 3.0 million dollars and current liabilities of 2.5 million. What are its working capital and current ratio?
Show answer
Working capital 500,000 dollars; current ratio 3.0 ÷ 2.5 = 1.2.
Revenue is 12 million dollars and receivables are 1.5 million. What is days sales outstanding?
Show answer
1.5 ÷ 12 × 365 ≈ 46 days.
Why might a seasonal manufacturer prefer to lease rather than buy equipment in March?
Show answer
Its cash is tied up in inventory before the selling season, and a lease spreads the cost over time instead of requiring a large payment.
Lesson quiz · 5 questions
Score 60% or more to complete this lesson.
Create a free account to save your progress, take quizzes and earn a certificate.