
PYTH-290 · Lesson 4 of 12 · 22 min
Project planning and team workflow
▶ Video coming soon A video version of this lesson is on the way.
A backlog and an architecture do not build software. People do, and three people working on the same code for five weeks need a shared way of working: how work is chosen, who does what, how progress is tracked, how code gets from one laptop into the main branch, and how problems are raised before they become crises. Teams that skip this step usually discover it in week three, when two people have rewritten the same file in different ways and nobody knows whether the project is on schedule.
On the Friday of the first week the team spent the morning agreeing their workflow. It was deliberately light, because a team of three does not need the ceremony of a large company, but every part of it had a reason. This lesson describes that workflow and the small tools the team used to forecast, sequence and track the work.
A light version of Scrum
Most software teams use some form of agile process, and the most widely used is Scrum. The Scrum Guide, last revised in 2020, describes work done in fixed-length iterations called sprints, a product owner who orders the backlog, developers who decide how to do the work, and a Scrum Master who helps the team follow the process and removes obstacles. Each sprint begins with planning, has a short daily meeting, and ends with a review of the work and a retrospective on the process.
Ridgeline's team adapted this to its size. Sprints were one week long, Monday to Friday, which gave three build sprints between the planning week and the final week. Rosa was the product owner. Jordan led the development work and also acted as Scrum Master, with Lena as an outside check. Sam and Nia were developers, and so, in the exercises, are you.
The meetings were short and fixed in the calendar so nobody had to arrange them:
- Sprint planning, Monday at 9:00, 45 minutes: Rosa explains the most important stories, the team checks they are ready, estimates them and picks what fits.
- Daily stand-up, 9:15 on other days, 10 minutes: each person says what they finished, what they will do next and whether anything is blocking them. Problems are noted and solved afterwards, not in the meeting.
- Sprint review, Friday at 14:00, 30 minutes: the team shows working software to Rosa and whoever the stories affect, such as Theo or Kai, and collects feedback.
- Retrospective, Friday at 14:30, 30 minutes: the team discusses what went well, what did not, and one or two changes to try next week.
Fixed times matter more than the exact format. When meetings happen at the same time every week, they cost almost no organizing effort and nobody is surprised by them.
The task board
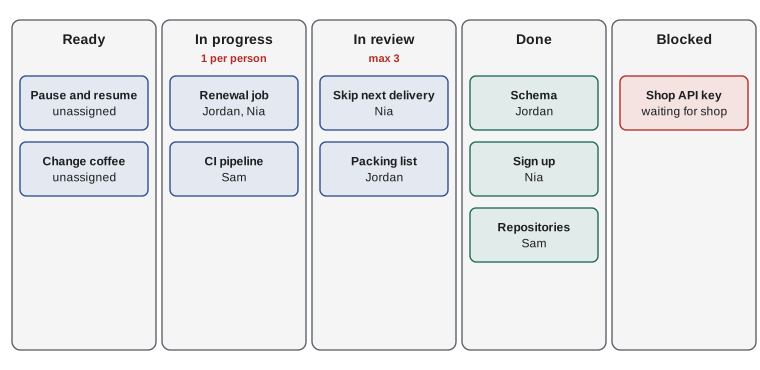
Work in progress lived on a board in the repository's issue tracker, with five columns: Ready, In progress, In review, Done, and Blocked. Each card was a story or a task under a story, with the person working on it. Anyone at Ridgeline could open the board and see exactly where things stood without asking.
The team borrowed one rule from the Kanban method: a limit on work in progress. Nobody could have more than one card in progress at a time, and the In review column could hold at most three cards. When review was full, developers stopped starting new work and reviewed each other's pull requests instead. The rule felt slow at first. Within a week it had made the team faster, because work stopped piling up half-finished and pull requests were reviewed in hours instead of days.
Definitions of ready and done
Lesson 2 introduced the two definitions that keep the board honest. The team wrote theirs into a CONTRIBUTING file in the repository on the first Friday. A story was ready to start when it had a clear benefit, acceptance criteria agreed with Rosa, an estimate, and no open questions. A story was done when all of these were true:
- The code is merged into the main branch through a reviewed pull request.
- Automated tests cover the acceptance criteria and the whole test suite passes in continuous integration.
- The acceptance criteria were shown to the product owner, who accepted them.
- Any new configuration, command or screen is described in the documentation.
- No known bugs remain open against the story.
The definition of done prevented the most common kind of false progress: stories that are finished except for testing, finished except for review, finished except for documentation. A story is either done or it is not, and the board only moves a card to Done when the whole list is true.
Estimating and forecasting
Story points, introduced in lesson 2, are relative: a 5-point story is roughly twice the work and uncertainty of a 2- or 3-point story. Points become useful for planning once a team knows its velocity, the number of points it actually finishes per sprint. Velocity is measured, not promised. In the first build sprint the team planned 21 points and finished 16, because the renewal job turned out larger than expected and nobody had remembered the time needed to set up continuous integration.
With a measured velocity, forecasting is simple arithmetic. Divide the points remaining by the average velocity and round up to whole sprints. A forecast is not a promise either; it is a range that improves as the team learns. Jordan used the average of the most recent sprints, and also showed Rosa a pessimistic forecast using the slowest sprint, so she could see the risk rather than a single comforting number.
import math

velocities = [16, 22]          # points finished in the first two build sprints
remaining = 29                 # points of Must and Should stories still to do

average = sum(velocities) / len(velocities)
likely = math.ceil(remaining / average)
pessimistic = math.ceil(remaining / min(velocities))
print(f"average velocity {average:.1f} points per sprint")
print(f"likely: {likely} more sprint(s); pessimistic: {pessimistic}")average velocity 19.0 points per sprint likely: 2 more sprint(s); pessimistic: 2
The forecast told the team, at the end of the second build sprint, that the remaining Must and Should stories would probably need two more sprints, but only one build sprint was left before the final week. Rather than hope, they acted: Rosa moved the four-weekly frequency and the weekly growth figure down to Could, and the team kept the final week for hardening, documentation and the demo. Making that call with a week to spare is the whole point of measuring.
Try it yourself
Forecast the remaining sprints
Write forecast(velocities, remaining, recent=3) that returns a tuple (likely, pessimistic): likely is the remaining points divided by the average of the last recent velocities, and pessimistic uses the smallest of those velocities. Round each up to a whole number of sprints with math.ceil.
If remaining is 0, return (0, 0). If there are no velocities yet, or every recent velocity is 0, raise ValueError because no forecast is possible.
def forecast(velocities, remaining, recent=3):
    average = sum(velocities) / len(velocities)
    return (round(remaining / average), round(remaining / average))

print(forecast([16, 22], 29))
Sequencing the work
Not every story can start on day one. The packing list needs renewal orders to exist; renewal orders need subscriptions and stock; the daily report needs orders. Some tasks also need shared foundations first, such as the database schema and the continuous integration pipeline. Before the first build sprint the team listed the main tasks and their dependencies, and worked out an order in which every task comes after the tasks it needs.
Finding such an order is a classic computer science problem called topological sorting, and Python's standard library solves it in the graphlib module. TopologicalSorter takes a mapping from each task to the tasks it depends on and produces an order that respects every dependency. If the dependencies contain a cycle, where A needs B and B needs A, it raises CycleError, which is exactly what you want to know before a sprint starts.
from graphlib import TopologicalSorter

NEEDS = {
    "schema": [],
    "ci pipeline": [],
    "subscription repo": ["schema"],
    "sign up": ["subscription repo"],
    "stock check": ["schema"],
    "renewal job": ["subscription repo", "stock check"],
    "packing list": ["renewal job"],
    "daily report": ["renewal job"],
}

order = list(TopologicalSorter(NEEDS).static_order())
print(" -> ".join(order))schema -> ci pipeline -> subscription repo -> stock check -> sign up -> renewal job -> packing list -> daily report
The order is not unique; several valid orders exist, and graphlib picks one. The useful information is in the structure: schema and the pipeline have no dependencies and can start immediately and in parallel, while the renewal job sits in the middle of the critical path. If it slips, the packing list and the daily report slip with it. That told Jordan to put the renewal job in the first build sprint and to give it to two people working together.
Try it yourself
Plan tasks in waves
Write waves(needs) that groups tasks into waves: wave 1 is every task with no dependencies, wave 2 is every task whose dependencies are all in wave 1, and so on. Return a list of waves, each a sorted list of task names. A dependency that is not itself a key in needs counts as already done.
If some tasks can never be scheduled because of a cycle, raise ValueError. You may use graphlib.TopologicalSorter and its get_ready() and done() methods, or write the loop yourself.
def waves(needs):
    return [sorted(needs)]

NEEDS = {
    "schema": [], "ci": [],
    "repo": ["schema"], "stock": ["schema"],
    "renewals": ["repo", "stock"], "packing": ["renewals"], "report": ["renewals"],
}
print(waves(NEEDS))
Tracking progress with a burndown
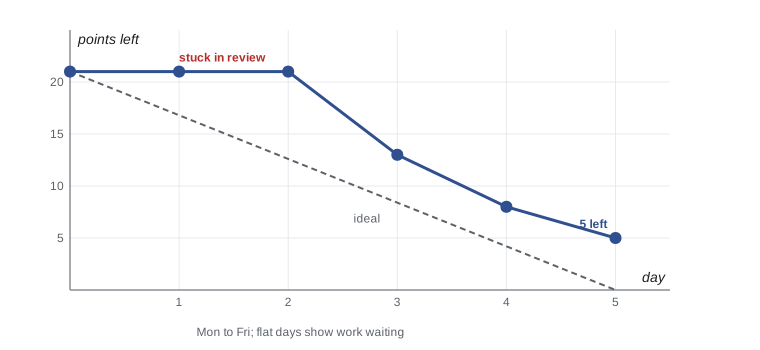
A burndown chart shows the points remaining in a sprint at the end of each day. In a healthy sprint the line falls steadily toward zero. A flat line for several days means work is stuck, usually in review or blocked on a question. A line that rises means work was added during the sprint. The chart is cheap to keep, since the tracker already knows the points on each card, and it starts conversations early: on the Wednesday of the first build sprint the line had not moved for two days, which revealed that three pull requests were waiting for review while everyone started new work.
The team also kept a simple risk register, a short table listing what could go wrong, how likely and how harmful it would be, and what they would do about it. The top risks at the start were the shop API refusing outside orders (resolved by the spike in lesson 3), Sam's exams in week four, which were planned around, and illness on demo day, handled by making sure at least two people could run every part of the demo.
Git workflow and continuous integration
The code lived in the ridgeline-ops repository in the same organization as the earlier ridgeline-tools repository from PYTH-110, with the same protections: nobody pushes directly to main; every change arrives through a pull request; every pull request needs one approving review and a passing build. The team used short-lived feature branches named after the issue, such as 14-skip-next-delivery, merged within a day or two. Long-lived branches drift apart and produce painful merges; short ones rarely conflict.
Continuous integration ran on every push: install the project, run the linter and the type checker, run the tests with coverage, and run the dependency-rule check from lesson 3. A pull request could not be merged until all of it passed. Setting this up took Sam most of a day in the first sprint, which nobody had estimated. It paid for itself within the week, when the pipeline caught a test that passed on Nia's laptop only because of a file left over from an earlier experiment.
Pull requests followed a short template: what changed and why, the issue it closes, how it was tested, and anything the reviewer should look at closely. Small pull requests were the rule. A change of 100 lines gets a careful review; a change of 1,000 lines gets a skim and an approval. Lesson 8 returns to how the team reviewed code.
Common mistakes
MistakeRunning long meetings because the process says to have them.
InsteadKeep meetings short, fixed in the calendar and focused; solve problems after the stand-up, not in it.
MistakeLetting everyone start new work while pull requests wait for review.
InsteadSet limits on work in progress; when review is full, review before starting anything new.
MistakeCounting stories as done when they still need tests, review or documentation.
InsteadUse a written definition of done and move a card only when every item is true.
MistakeTreating a forecast as a promise.
InsteadForecast from measured velocity, show a pessimistic range, and adjust scope early when the numbers say so.
MistakeStarting tasks before the tasks they depend on.
InsteadList dependencies and order the work; put the critical path first.
MistakeWorking on long-lived branches and merging at the end.
InsteadUse short branches merged within a day or two through reviewed pull requests and continuous integration.
Summary and key terms
- A small team still needs an agreed workflow for choosing, tracking and integrating work.
- Scrum organizes work into sprints with planning, daily stand-ups, a review and a retrospective.
- A task board with limits on work in progress keeps work flowing and reviews prompt.
- Definitions of ready and done prevent false progress.
- Velocity is measured; forecasts divide remaining points by it and round up, with a pessimistic range.
- Topological sorting orders tasks by their dependencies and reveals cycles and the critical path.
- Burndown charts and a risk register make problems visible early.
- Short branches, reviewed pull requests and continuous integration keep the main branch working.
- sprint
- A fixed-length period in which a team builds a set of backlog items.
- Scrum
- An agile framework of sprints, roles and regular meetings for building products.
- stand-up
- A short daily meeting where team members share progress, plans and obstacles.
- work in progress limit
- A cap on how many items may be in a stage of work at once.
- velocity
- The number of story points a team actually finishes per sprint.
- topological sort
- An ordering of tasks in which every task comes after the tasks it depends on.
- critical path
- The longest chain of dependent tasks, which determines the earliest finish.
- burndown chart
- A chart of the work remaining in a sprint, plotted day by day.
- risk register
- A list of possible problems with their likelihood, impact and planned response.
- continuous integration
- Automatically building and testing every change as it is pushed.
Practice problems
Work each problem on paper first, then reveal the answer to check.
The team finished 18, 14 and 22 points in three sprints. What is the average velocity?
Show answer
(18 + 14 + 22) / 3 = 18 points per sprint.
With 40 points left and that average, how many sprints does the likely forecast give?
Show answer
40 / 18 = 2.2, which rounds up to 3 sprints.
Why does the team limit the In review column?
Show answer
So developers review waiting pull requests instead of starting new work, which keeps work flowing.
Task C needs B, B needs A, and A needs C. What will TopologicalSorter do?
Show answer
Raise CycleError, because the tasks form a cycle and no valid order exists.
What does a flat line for two days on a burndown chart usually mean?
Show answer
Work is stuck, often waiting for review or blocked on a question.
Give two reasons to prefer short-lived branches.
Show answer
They rarely conflict with main, and small pull requests get careful reviews.
Lesson quiz · 5 questions
Score 60% or more to complete this lesson.
Create a free account to save your progress, take quizzes and earn a certificate.