
PRIN-141 · Lesson 7 of 12 · 25 min
Managing a stage boundary I: planning the next stage and updating the plans
A stage boundary is a decision point. At the end of each stage except the last, the board must decide whether the project is still worth doing and, if so, whether to commit the resources for the next stage. Managing a stage boundary is the process that gives the board what it needs for that decision. It looks backward, reporting on the stage just ending, and forward, planning the next stage and updating the project plan and the business case. This lesson covers the forward-looking part. Lesson 8 covers the end stage report and the board's decision, and lesson 9 covers the other use of the process: producing an exception plan.
When managing a stage boundary starts
Managing a stage boundary starts when the project manager, reviewing the stage status, sees that the end of the stage is approaching. It should start early enough for the products to be ready when the stage ends, so that the board can decide without leaving teams idle. For Ridgeline Water's pilot, which ends at week 38, the project manager started planning rollout stage 1 at week 33, five weeks ahead, because the rollout needed supplier capacity confirmed and a council report prepared. The process runs in parallel with controlling a stage, which continues until the stage's last products are delivered.
| Activity (in our words) | Main output | Ridgeline Water at the pilot boundary |
|---|---|---|
| Plan the next stage | Next stage plan | Rollout stage 1 plan: 16,800 meters, weeks 38 to 68 |
| Update the project plan | Updated project plan | Actuals for initiation and pilot; forecasts for both rollout stages |
| Update the business case | Updated business case | Pilot leak data; revised costs; NPV recalculated |
| Review and update risks | Updated risk register | Pilot risks closed; rollout risks added |
| Report stage end | End stage report | Lesson 8 |
| Produce an exception plan (only when requested) | Exception plan | Lesson 9 |
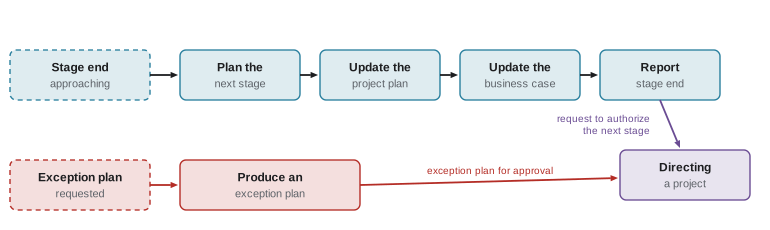
Planning the next stage
The next stage plan is produced the same way as any PRINCE2 plan: product-based planning, estimating, scheduling, resourcing and analysing risks, as PRIN-130 described. What makes a next stage plan special is its timing. It is produced with the benefit of everything learned so far, so it should be more detailed and more accurate than the outline in the project plan. It must also reflect decisions made during the current stage that affect the next one: changes deferred, requirements moved, lessons learned.
Ridgeline's rollout stage 1 plan draws on three sources. The lessons log supplies the realistic installation rate of 9 meters per crew per day, the two-week appointment booking practice and the need to order components with long lead times before the stage starts. The issue register supplies two decisions that move work into the stage: the 200 connections at the seniors' housing complex, deferred by the board, and the hourly interval data requirement, moved from the pilot when the billing team used daily totals. And the pilot's actual costs supply better estimates than the original plan had.
| Rollout stage 1 product or cost | Basis | Estimate ($000) |
|---|---|---|
| 16,800 meters installed (including the seniors' complex) | Volume rate in the contract, 0.188 per meter | 3,158 |
| Collector network extension | Pilot network cost per square kilometre | 260 |
| Billing interface: hourly interval data | Vendor patch plus two sprints | 60 |
| Customer communication and appointments | Pilot cost per meter, scaled | 70 |
| Project management and assurance | 30 weeks at pilot rates | 150 |
| Total | 3,698 |
The schedule is driven by installation capacity. At 9 meters per crew per day, 16,800 meters in 30 weeks need about 13 or 14 crews working steadily, roughly three times the pilot's crews. Northline confirmed it could supply 12 crews from week 40 and 14 from week 44. The plan allows two weeks of mobilization and training at the start, starts installations in the streets nearest the existing collectors, and phases the network extension ahead of the crews.
meters, weeks_available = 16800, 30
rate, days = 9, 5
mobilization = 2
crews_needed = meters / (rate * days * (weeks_available - mobilization))
plan = [(12, 4), (14, 24)]   # (crews, weeks) after mobilization
installed, week = 0, mobilization
for crews, n in plan:
    for _ in range(n):
        installed += crews * rate * days
        week += 1
print(f"crews needed for steady work: {crews_needed:.1f}")
print(f"planned capacity by week {week} of the stage: {installed:,} meters (need {meters:,})")
print(f"margin: {installed - meters:+,} meters, about {(installed - meters) / (14 * rate * days):.1f} weeks of fourteen crews")crews needed for steady work: 13.3 planned capacity by week 30 of the stage: 17,280 meters (need 16,800) margin: +480 meters, about 0.8 weeks of fourteen crews
The plan has a margin of 480 meters, a little under a week of full-crew output, which the project manager will use for weather and appointment no-shows. That margin is thin for a winter stage, so the plan also schedules the older, harder streets before week 55 and leaves the simpler streets for the cold weeks. The margin is not stage tolerance; it is built into the plan. The project manager proposes stage tolerances on top of it: cost +5 % and −10 %, time +2 weeks, scope 16,500 to 16,800 meters and a read rate of at least 97.5 %.
Updating the project plan
The project plan shows the whole project. At each stage boundary, the project manager updates it with the actual results of the stage just ending and the latest forecasts for the remaining stages, including the next stage plan just produced. The board uses the updated project plan to see whether the project as a whole is still within the project tolerances the business layer set, and how much of them has been used.
| Stage | Baseline ($000) | Actual or forecast ($000) | Variance |
|---|---|---|---|
| 1 Initiation | 160 | 158 actual | −2 |
| 2 Pilot | 1,450 | 1,581 actual | +131 |
| 3 Rollout stage 1 | 3,700 | 3,698 forecast | −2 |
| 4 Rollout stage 2 and closure | 4,290 | 4,290 forecast | 0 |
| Total | 9,600 | 9,727 | +127 |
The project is forecasting 127 thousand over its baseline, which uses about 26 % of the 480 thousand project cost tolerance. On time, the forecast end remains week 100, because rollout stage 2 absorbs the one-week slip. These figures will appear in the end stage report so that the board can see the project position alongside the stage results.
Updating the business case
The business case is the reason the project exists. At each stage boundary, the project manager updates it with the latest costs, timescales, risks and, crucially, evidence about benefits. For Ridgeline, the pilot was designed to test the biggest uncertainty in the business case: how much leakage the smart meters would help the utility find. PRIN-140 noted that the rollout should be reconsidered if leak savings came in below about 70 % of forecast.
The pilot district's data are encouraging. Over 14 weeks of full coverage, continuous-flow alerts found 61 customer-side leaks and the network team located two main leaks from district metering, saving water at a rate equivalent to about 85 % of the forecast for that district. The code below uses a simple sensitivity model built from PRIN-130's appraisal, in which the project's NPV moves linearly with the share of forecast leak savings achieved, and adjusts for the extra pilot cost.
npv_full, npv_half = 2309, -708          # PRIN-130: NPV at 100 % and 50 % of forecast leak savings
def npv_at(share):
    return npv_half + (npv_full - npv_half) * (share - 0.5) / 0.5
extra_cost = 127                           # project cost forecast above baseline, roughly in present value
for share in (1.0, 0.85, 0.70):
    print(f"leak savings at {share:.0%} of forecast: NPV {npv_at(share) - extra_cost:,.0f}k")
threshold = 0.5 + 0.5 * (extra_cost - npv_half) / (npv_full - npv_half)
print(f"break-even share of forecast leak savings: {threshold:.0%}")leak savings at 100% of forecast: NPV 2,182k leak savings at 85% of forecast: NPV 1,277k leak savings at 70% of forecast: NPV 372k break-even share of forecast leak savings: 64%
At 85 % of the forecast leak savings and with the extra pilot cost, the NPV is about 1,280 thousand: lower than the original 2,309 thousand but still clearly positive. The break-even point is about 64 % of forecast leak savings. The pilot district is only one district, so the updated business case states the evidence honestly: strong in a district with older mains, not yet tested in the newer subdivisions that make up much of rollout stage 2. The project manager adds a risk on that point and a benefit measure for rollout stage 1, so that the next boundary decision will be based on wider evidence.
Ridgeline Water's updated business case also feeds the municipality's asset management plan, which provincial asset management planning rules expect to show the condition, performance and lifecycle costs of core water infrastructure. The smart meter data on leaks and consumption improve the plan's evidence, and the asset management team is listed as a stakeholder in the communication management approach.
Reviewing risks and other products
The project manager also reviews the risk register and the other parts of the project initiation documentation. Pilot risks that no longer apply, such as late pilot meter delivery, are closed. Rollout risks are added or reassessed: installer capacity, winter productivity, newer subdivisions with different plumbing, customer resistance at scale. The management approaches are checked to see whether they still fit: the communication approach, for example, needs a broader campaign for 16,800 households. Any changes to the PID's components are made under change control and reported at the boundary.
| Product reviewed | Change at the pilot boundary |
|---|---|
| Risk register | Six pilot risks closed; five rollout risks added, including newer subdivisions and winter productivity |
| Communication management approach | Broader campaign; council and media briefings before rollout |
| Quality management approach | Sample reduced from 5 % to 3 % after a stable pilot, with a trigger to increase it |
| Commercial management approach | Volume pricing tier activated; crew numbers confirmed in a contract variation |
| Benefits management approach | Leak savings to be measured in a newer subdivision during rollout stage 1 |
| Project controls | Highlight reports fortnightly; weekly during the first four weeks of rollout |
Worked problem
Next stage plan or more of the same?
A project manager's draft plan for the next stage copies the stage plan from the project plan unchanged, because 'it was approved at initiation'. The current stage found a better installation method, deferred one change into the next stage and showed that one estimate was 40 % too low. What is wrong?
Show solution
- The next stage plan should be produced with current knowledge, not copied from the outline in the project plan.
- The deferred change must appear in the next stage plan, with its cost and schedule effect.
- The low estimate must be corrected using actual data from the current stage.
- The better method is a lesson that should change how the next stage is planned.
- The updated project plan and business case must reflect the new next stage plan.
Answer: The next stage plan must be built from what the project now knows: lessons, deferred changes and actual data. Copying the initiation outline defeats the purpose of the stage boundary.
Common mistakes
MistakeStarting the next stage plan after the current stage has ended.
InsteadStart managing a stage boundary as the stage end approaches.
MistakeCopying the outline from the project plan as the next stage plan.
InsteadBuild the next stage plan from current knowledge, lessons and changes.
MistakeUpdating the stage plan but not the project plan.
InsteadUpdate the project plan with actuals and forecasts so the board sees the whole project.
MistakeLeaving the business case unchanged at a boundary.
InsteadUpdate it with current costs, risks and benefit evidence.
MistakeTreating planned margin as tolerance.
InsteadKeep margin inside the plan and set tolerances separately.
Summary and key terms
- Managing a stage boundary prepares the board's decision at the end of each stage except the last.
- It starts as the stage end approaches and runs alongside controlling a stage.
- The next stage plan is built from current knowledge: lessons, deferred changes and actual results.
- The project plan is updated with actuals and forecasts so the board can see project tolerance used.
- The business case is updated with current costs, risks and benefit evidence.
- Risks and other PID components are reviewed and updated under change control.
- Next stage plan
- The detailed plan for the following stage, produced in managing a stage boundary.
- Stage boundary
- The point at the end of a stage where the board decides whether to continue.
- Updated project plan
- The project plan revised with actual results and current forecasts.
- Updated business case
- The business case revised with current costs, risks and benefits evidence.
- Break-even
- The value of an uncertain input at which the investment's NPV is zero.
- Mobilization
- The period at the start of a stage when resources are brought in and trained.
Practice problems
Work each problem on paper first, then reveal the answer to check.
What triggers managing a stage boundary in the normal case?
Show answer
The stage end approaching.
When did Ridgeline's project manager start planning rollout stage 1?
Show answer
At week 33, five weeks before the pilot ended.
Name three sources used for the rollout stage 1 plan.
Show answer
The lessons log, decisions in the issue register and the pilot's actual costs.
What is the rollout stage 1 budget?
Show answer
About 3,698 thousand.
How many crews does the rollout need for steady work?
Show answer
About 13 to 14 (13.3 at the realistic rate).
How much of the project cost tolerance is used at the pilot boundary?
Show answer
About 26 % (127 of 480 thousand).
What share of forecast leak savings did the pilot show?
Show answer
About 85 %.
What is the updated NPV with the pilot evidence?
Show answer
About 1,280 thousand.
What is the break-even share of forecast leak savings?
Show answer
About 64 %.
Why is the pilot evidence not conclusive?
Show answer
It comes from one district with older mains; newer subdivisions have not been tested.
Lesson quiz · 5 questions
Score 60% or more to complete this lesson.
Create a free account to save your progress, take quizzes and earn a certificate.