
PHYS-499 · Lesson 5 of 12 · 21 min
Planning research: questions, hypotheses, timelines and risk
▶ Video coming soon A video version of this lesson is on the way.
A research plan does not predict what will happen; it prepares you for what might. Research is uncertain by definition, and experienced researchers plan precisely because they expect surprises. A good plan states the question in testable form, turns it into specific hypotheses with quantitative predictions, decides what measurements or calculations would distinguish between them, lays out a schedule anchored on the deadlines, and identifies the risks that could derail the project together with what will be done about each. This lesson works through each of these steps with Maya's project and shows why a few hours of planning in October can save weeks in February.
From a question to testable hypotheses
A research question becomes useful when it is sharp enough that some possible result would answer it. Maya's question, how well a first-principles model predicts the terminal speed with no adjustable parameters, was a good start but still too broad to plan around. She broke it into hypotheses, each of which could be tested with a definite measurement and each of which made a quantitative prediction. A hypothesis in this sense is not a guess about the outcome but a precise claim that the data can contradict.
Each hypothesis in the table can fail, and that is what makes it useful. H1 is almost certain to hold, since the drag is proportional to the conductivity in every model, but testing it checks the apparatus and the conductivity measurements together; if it failed, something in the setup would be wrong. H2 was expected to fail, because the magnet nearly fills the pipe, but by how much and in what pattern was not known. H3 was the real test of the project. H4 was the stretch goal: it tests the conductivity dependence through a different route, by changing the temperature of one pipe rather than by comparing different metals, so that differences in geometry between pipes cannot be responsible for the result.
Writing the predictions down before taking data has a further purpose: it protects against fooling yourself. If you decide after seeing the data which comparison to make, which pipes to include and what counts as agreement, it is easy to choose, without meaning to, the options that make the result look best. Physicists sometimes guard against this by blind analysis, in which the analysis procedure is fixed before the key result is revealed. A full blind analysis is unusual in an honours project, but writing the hypotheses, predictions and comparison criteria into the proposal achieves much of the same protection, and examiners notice it.
Designing the measurements
With hypotheses in hand, the plan must say what to measure, how precisely and how many times. The precision needed follows from the size of the effects to be distinguished. If the point-dipole and finite-magnet models differ by 20 to 30 per 100 in a tight pipe, a measurement good to a few per 100 easily distinguishes them; if H3's prediction is to be tested at the level of 4 per 100, each terminal speed must be known to about 1 per 100, and each model input to about the same level. Maya worked backward from those targets. Ten drops per pipe, each timed by light gates to a millisecond over 0.8 m, would give a standard error on the mean of well under 1 per 100 if the drop-to-drop scatter was about 1 per 100. The dipole moment needed a calibration good to 1 or 2 per 100, and the conductivity of each pipe needed a four-point resistance measurement rather than a handbook value.
Controls belong in the plan too. A control is a measurement in which the effect under study is absent or known, so that it reveals problems with the apparatus. Maya planned two. A slotted copper pipe, cut along its length so that eddy currents cannot circulate around the circumference, should let the magnet fall almost freely, which tests the timing system against a known acceleration. A nonmagnetic steel slug of the same size and mass, dropped through the copper pipes, should also fall freely and reveals any friction against the walls. Planning controls in advance is cheap; discovering in March that you needed one is not.
Planning backward from the deadline
The most reliable way to build a schedule is backward from the fixed deadlines. Start with the thesis submission date and ask what must be finished by then, how long each piece takes and what depends on what. Writing the final thesis needs analysed results; analysis needs data; data need calibrated apparatus; calibration needs working apparatus; and so on back to the present. Each task gets an estimated duration, and, because estimates are usually optimistic, a margin. The chain of dependent tasks with no slack is the critical path, and it is the chain to watch most closely.
# task: (duration in weeks, prerequisites)
tasks = {
    "literature":   (3, []),
    "apparatus":    (6, []),
    "calibration":  (3, ["apparatus"]),
    "model code":   (5, ["literature"]),
    "validation":   (2, ["model code"]),
    "measurements": (5, ["calibration"]),
    "analysis":     (5, ["measurements", "validation"]),
    "cold pipe":    (2, ["measurements"]),
    "writing":      (7, ["analysis"]),
}
order, done = [], set()
while len(order) < len(tasks):                      # topological order
    for t, (d, pre) in tasks.items():
        if t not in done and all(p in done for p in pre):
            order.append(t); done.add(t)
early = {}
for t in order:                                      # forward pass: earliest finish
    d, pre = tasks[t]
    early[t] = max([early[p] for p in pre], default=0) + d
finish = max(early.values())
late = {t: finish for t in tasks}                     # backward pass: latest finish
for t in reversed(order):
    for p in tasks[t][1]:
        late[p] = min(late[p], late[t] - tasks[t][0])
print(f"earliest finish: week {finish} (deadline: week 30)")
for t in order:
    slack = late[t] - early[t]
print(f" {t:13s} ends week {early[t]:2d} slack {slack:2d} {'CRITICAL' if slack == 0 else ''}")earliest finish: week 26 (deadline: week 30) literature ends week 3 slack 4 apparatus ends week 6 slack 0 CRITICAL calibration ends week 9 slack 0 CRITICAL model code ends week 8 slack 4 validation ends week 10 slack 4 measurements ends week 14 slack 0 CRITICAL analysis ends week 19 slack 0 CRITICAL cold pipe ends week 16 slack 10 writing ends week 26 slack 0 CRITICAL
The calculation shows that the plan finishes in week 26 of a 30-week year, leaving a four-week margin, and that the critical path runs through the apparatus, calibration, measurements, analysis and writing. The model code has several weeks of slack, which means Maya could spend extra time on validation without endangering the thesis, while a delay in the apparatus would come straight out of the margin. The cold-pipe measurement, her stretch goal, also has slack: it can be squeezed in during the analysis period, or dropped without consequence. Seeing that structure early changed her priorities. She ordered the pipes and the Hall probe in the first week of September, before she had finished the reading, because the apparatus was the bottleneck.
Risks and how to manage them
Every project has risks: things that might go wrong and would hurt the project if they did. A risk register lists them, estimates for each the likelihood and the impact on a simple scale, and records what will be done to reduce the likelihood, to reduce the impact, or to detect the problem early. The point is not bureaucracy. It is to make you think, in October, about the problems that would otherwise surprise you in February, and to decide in advance what you would do.
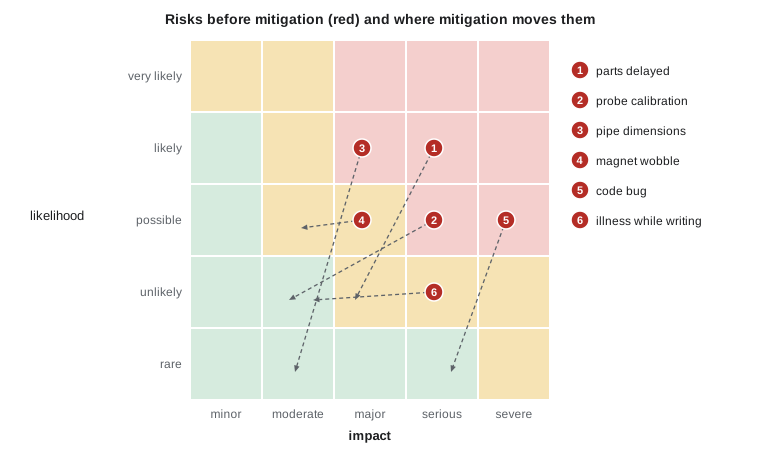
# risk: (likelihood 1-5, impact 1-5, mitigation, likelihood and impact after mitigation)
risks = {
    "parts delayed":              (4, 4, "order in week 1; borrow a pipe from the teaching lab", (2, 3)),
    "Hall probe miscalibrated":   (3, 4, "check against a reference coil of known field",       (2, 2)),
    "pipe dimensions off nominal":(4, 3, "measure every pipe with a micrometer and calipers",   (1, 2)),
    "magnet wobble off axis":     (3, 3, "alignment sleeve tests; report as systematic",         (3, 2)),
    "model code bug":             (3, 5, "test against the exact thick-wall formula",           (1, 4)),
    "illness while writing":      (2, 4, "draft chapters from December onward",                (2, 2)),
}
ranked = sorted(risks.items(), key=lambda kv: -kv[1][0]*kv[1][1])
print(f"{'risk':30s} score  after  mitigation")
for name, (p, i, how, (p2, i2)) in ranked:
    print(f"{name:30s} {p*i:4d} {p2*i2:6d}   {how}")
before = sum(p*i for p, i, _, _ in risks.values()); after = sum(a*b for _, _, _, (a, b) in risks.values())
print(f"total exposure: {before} before, {after} after mitigation")risk score after mitigation parts delayed 16 6 order in week 1; borrow a pipe from the teaching lab model code bug 15 4 test against the exact thick-wall formula Hall probe miscalibrated 12 4 check against a reference coil of known field pipe dimensions off nominal 12 2 measure every pipe with a micrometer and calipers magnet wobble off axis 9 6 alignment sleeve tests; report as systematic illness while writing 8 4 draft chapters from December onward total exposure: 72 before, 26 after mitigation
Two features of the register are typical. The highest-scoring risks are mundane: parts arriving late and a bug in the model code. Students tend to worry about dramatic failures, but most projects are hurt by ordinary delays and unnoticed errors. And mitigation works in different ways. Ordering early reduces the likelihood of delay; borrowing a teaching-lab pipe reduces its impact; testing the code against an exact formula detects a bug early, which reduces its impact from severe to major. One risk, the magnet wobbling off the axis of the pipe, could not be reduced much. Maya decided to measure its effect as a systematic uncertainty, which is often the right response to a risk that cannot be removed: turn it into something you quantify.
Keeping the plan alive
A plan written in October and never revisited is not much use. Review it at every milestone and roughly once a month: update the durations with what you have learned, mark finished tasks, revisit the risk register, and decide whether the floor, target and stretch goals still make sense. When the plan changes, record why, because the reasons often belong in the thesis. Maya's plan changed twice. In November a Hall probe calibration problem, described in lesson 6, added two weeks to the critical path and consumed half of her margin. In January the measurements went faster than expected, which made room for the cold-pipe stretch goal. Both changes, and the reasons for them, appear in her thesis's chapter on methods.
Finally, share the plan. Give your supervisor a copy, review it together at the start of each term, and agree on what will happen if things slip. A supervisor who knows the critical path can help in practical ways, by lending equipment, by finding time on a shared instrument, or by suggesting a simpler route to the floor goal. A supervisor who discovers in March that the apparatus never worked cannot.
Worked problem
Turning a vague aim into a hypothesis
Ravi writes: I want to see whether my Ising simulation gets the critical exponent right. Turn this into a testable hypothesis with a prediction.
Show solution
- Name the quantity: the exponent \(\beta\) of the magnetization near the critical temperature of the two-dimensional Ising model on a square lattice.
- State the prediction: finite-size scaling of the magnetization at the critical temperature over lattice sizes from 16 to 128 gives \(\beta/\nu = 0.125\), the exact value.
- State the test: fit the slope of the logarithm of the magnetization against the logarithm of the lattice size, with bootstrap uncertainties.
- State what would contradict it: a fitted slope that differs from 0.125 by more than three standard errors, which would point to correlated samples, too small lattices or a code error.
Answer: A hypothesis with a specific quantity, a numerical prediction, a test and a stated criterion for failure.
Common mistakes
MistakeWriting hypotheses that cannot fail.
InsteadState each as a quantitative prediction and say in advance what result would contradict it.
MistakeDeciding after seeing the data which comparison to make.
InsteadFix the comparisons and agreement criteria in the proposal, as a light form of blind analysis.
MistakePlanning forward from today rather than backward from the deadline.
InsteadWork back from the submission date, add margins, and find the critical path.
MistakeListing only dramatic risks.
InsteadMost projects are hurt by ordinary delays and unnoticed errors; plan for those.
MistakeLeaving out controls.
InsteadPlan measurements where the effect is absent or known, to test the apparatus.
Summary and key terms
- Turn the research question into hypotheses with quantitative predictions and stated conditions under which each would be contradicted.
- Writing predictions and comparison criteria in advance protects against choosing analyses that flatter the result.
- Design measurements backward from the precision needed, and include controls in which the effect is absent or known.
- Plan backward from deadlines, find the critical path and its slack, and act early on the bottleneck.
- Keep a risk register of likelihood and impact with mitigations, and review the plan at every milestone.
- Hypothesis
- A precise claim with a quantitative prediction that data could contradict.
- Blind analysis
- An analysis whose procedure is fixed before the key result is revealed.
- Control
- A measurement in which the effect under study is absent or known, used to test the apparatus.
- Slack
- How long a task can slip without delaying the project.
- Risk register
- A list of risks with likelihood, impact and planned mitigation.
Practice problems
Work each problem on paper first, then reveal the answer to check.
Why is H1 worth testing even though every model predicts it?
Show answer
It checks the apparatus and the conductivity measurements together; a failure would reveal a problem in the setup.
In the schedule code, how many weeks of slack does the model code have?
Show answer
Four weeks: its earliest finish is week 8, but it could finish as late as week 12 and validation would still be done by week 14, when the measurements end and analysis can begin.
Suggest a control for Olivia’s muon detector.
Show answer
Count with the detector shielded or with one paddle disconnected, to measure accidental coincidences and electronic noise.
A risk has likelihood 4 and impact 2. Is it more urgent than one with likelihood 2 and impact 5?
Show answer
By the product score, 8 against 10, the second is slightly more urgent, but a severe impact often deserves attention even when unlikely.
What should happen when the plan changes?
Show answer
Record the change and the reason, update the critical path and risk register, and tell your supervisor.
Lesson quiz · 5 questions
Score 60% or more to complete this lesson.
Create a free account to save your progress, take quizzes and earn a certificate.