
PHYS-499 · Lesson 10 of 12 · 22 min
Writing the thesis: structure, figures and scientific style
▶ Video coming soon A video version of this lesson is on the way.
The thesis is the permanent record of the project and the main thing examiners assess. It must explain the question, the method, the results and their meaning clearly enough that a physicist outside your group can follow the argument, check the key steps and judge the conclusions. Good scientific writing is not a matter of style for its own sake. It is the craft of making a complicated argument easy to follow and hard to misread. This lesson covers the structure of a physics thesis, how to write each part, how to make figures that carry the argument, the conventions of scientific prose and of equations, the tools physicists use to write, and how to plan the writing so that it is finished on time.
The structure of a physics thesis
Most physics theses, like most physics papers, follow a structure that readers expect. Departures from it are possible but cost the reader effort, so use the standard structure unless you have a reason not to. A typical honours thesis of 30 to 60 pages has an abstract of about 200 words; an introduction that states the question, why it matters and what the thesis found; a background or theory chapter that sets out the physics and the literature; a methods chapter describing the apparatus, calibrations, code and analysis procedures; a results chapter presenting the data and comparisons; a discussion that interprets the results, examines uncertainties and limitations and relates them to previous work; a conclusion; references; and appendices for derivations, code listings and data tables that would interrupt the main text.
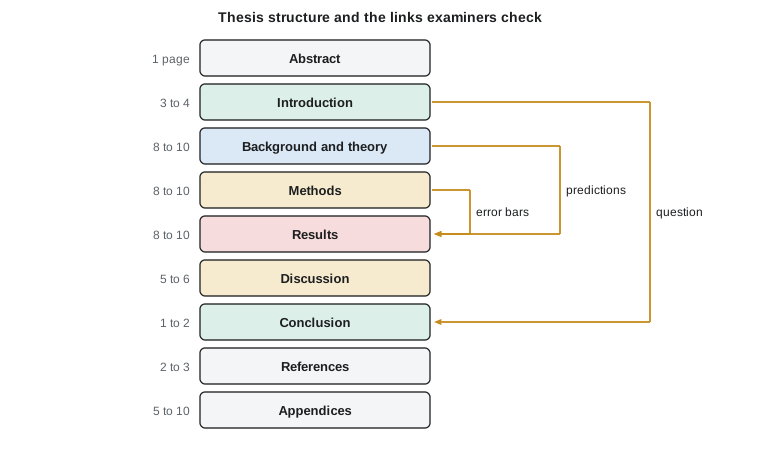
The parts are not independent. The introduction poses the question that the conclusion answers, so the two should be written to match. The theory chapter makes predictions that the results chapter tests, so every prediction should reappear in the results with its comparison. The methods chapter establishes uncertainties that appear as error bars in the results. Examiners read with these links in mind, and a thesis in which the introduction promises something the conclusion never delivers, or in which a prediction is derived and never tested, reads as unfinished. Before submitting, trace each link and make sure it holds.
Writing each part
The abstract is the most-read part of any scientific document and should be written last. In about 200 words it should state the question, the method, the main results with numbers and uncertainties, and the main conclusion. Maya's ended: "Point-dipole models underestimate the measured speeds by 17 to 37 per 100, by an amount that grows as the gap between magnet and wall shrinks. A finite-magnet model with no adjustable parameters fits all five pipes with a common ratio of measured to predicted speed of 0.973, about one standard uncertainty from 1, and cooling a pipe to minus 17 degrees slows the magnet by the factor its measured conductivity change predicts." Every number in that sentence appears with its derivation later in the thesis.
The introduction should take the reader from the general to the specific in a few pages: the phenomenon and why it is interesting, what is known, the gap, the question this thesis asks, how it answers it, and what it finds. Stating the main result at the end of the introduction is normal in physics and helps the reader; a thesis is not a mystery story. The background chapter develops the physics the reader needs, at the level of a strong final-year student, and summarizes the literature as a synthesis, as lesson 4 described. Derive what is central to your work; cite what is standard.
The methods chapter should allow a competent reader to repeat the work. Describe the apparatus with a labelled diagram, list the instruments and their calibrations, describe the code and how it was verified, and set out the analysis procedure, including any exclusions and their reasons. It is also the place for the story of problems that were found and fixed, told briefly and factually, such as Maya's 1.5 mm probe offset, because those stories show the examiner how carefully the work was done. The results chapter presents what was found, mainly in figures and tables, with enough text to guide the reader through them. The discussion interprets: what the results mean, how they compare with predictions and previous work, what the uncertainties and limitations are, and what remains open. Keep results and interpretation separate where you can, so the reader can tell what was measured from what you conclude.
Figures that carry the argument
In physics, figures usually carry the main results, and many readers look at them before reading the text. Each figure should make one point, and its caption should state that point as well as describe what is plotted. Label every axis with the quantity and its unit. Show uncertainties as error bars and say in the caption what they represent. Distinguish data from models clearly, with points for data and lines for models, and say whether each model is fitted or predicted. Use a type size that is readable at the size the figure will be printed. Choose linear or logarithmic axes deliberately; Maya used logarithmic axes for the plot of measured against predicted speed because the speeds span a factor of four, and linear axes for the residual plot because the residuals are small. Plotting the residuals, measured divided by predicted or measured minus predicted in units of uncertainty, is often the clearest way to show how well a model works, because a good overall fit can hide systematic trends that are obvious in a residual plot.
Colour should help, not carry meaning alone, because many readers have some form of colour-vision deficiency and many theses are printed in black and white. Use different marker shapes and line styles as well as colours. Avoid three-dimensional effects, shading and decorations that do not encode data. Generate every figure from data with code, as lesson 7 described, so that if the data or analysis changes the figure can be regenerated exactly, and so that the examiner's question about how a figure was made has a precise answer.
Scientific style
Scientific prose should be clear, precise and economical. Prefer short sentences with one idea each. Put the important information at the end of the sentence, where readers expect it. Use the same term for the same thing throughout; if you call it the drag coefficient in chapter 2, do not call it the damping constant in chapter 4. Define every symbol when it first appears and keep notation consistent. Use the active voice where it is clearer, as in "we measured the moment with a Hall probe", which physics journals have broadly accepted, while the passive voice remains common for describing procedures. Numbers should carry units and appropriate significant figures, consistent with their uncertainties: \(5.32 \pm 0.02\) cm/s, not \(5.3194 \pm 0.0213\). Avoid vague intensifiers such as very, clearly and obviously, which add nothing and can irritate an examiner who does not find the point obvious.
Equations are part of the sentence that contains them and are punctuated accordingly. Number the equations you refer to later. Introduce each with enough words that the reader knows why it is there, and follow it with the meaning of any new symbols. Derivations that are standard can be cited; derivations that are yours, or that you adapted, belong in the text or an appendix with enough steps that an examiner can check them. Maya's derivation of the drag integral in lesson 7, with the factor 45/1024 traced to a beta-function integral, occupies a page and a half of her background chapter, and her examiners said it was one of the clearest parts of the thesis.
Tools: LaTeX, references and version control
Almost all physics theses are written in LaTeX, the document preparation system built by Leslie Lamport in the 1980s on Donald Knuth's TeX, because it typesets mathematics beautifully, handles numbered equations, figures, tables and cross-references automatically, and works smoothly with BibTeX for references. Many universities provide thesis templates. Online editors such as Overleaf make collaboration with a supervisor easy; a local installation works equally well with version control. Keep the thesis source in the same repository as the analysis code, so that figures and numbers can be regenerated and pulled into the document automatically. The listing below is a minimal thesis skeleton.
\documentclass[12pt]{report}
\usepackage{amsmath, graphicx, siunitx}
\usepackage[style=phys, sorting=none]{biblatex}
\addbibresource{thesis.bib}
\title{Predicting Eddy-Current Drag on a Magnet Falling Through a Conducting Pipe}
\author{Maya Desjardins}
\begin{document}
\maketitle
\begin{abstract}
We test three models of the drag on a magnet falling through conducting
pipes against measured terminal speeds ...
\end{abstract}
\tableofcontents
\chapter{Introduction}\label{ch:intro}
\chapter{Theory}\label{ch:theory}
The drag coefficient is
\begin{equation}
  k = \sigma \int_a^b \int_{-\infty}^{\infty} 2\pi r\, B_r(r,z)^2 \, dz\, dr ,
  \label{eq:drag}
\end{equation}
which for a point dipole \(m\) in a thin wall reduces to
\(k = 45\mu_0^2 m^2 \sigma w / (1024 a^4)\) \cite{pointdipole}.
\chapter{Methods}\label{ch:methods}
\chapter{Results}\label{ch:results}
Figure~\ref{fig:compare} compares measured and predicted speeds.
\begin{figure}
  \centering
  \includegraphics[width=0.8\textwidth]{figures/compare.pdf}
  \caption{Measured against predicted terminal speeds ...}
  \label{fig:compare}
\end{figure}
\chapter{Discussion}\label{ch:discussion}
\chapter{Conclusion}\label{ch:conclusion}
\printbibliography
\appendix
\chapter{Analysis code}\label{app:code}
\end{document}
Two details in the skeleton are worth noting. The siunitx package typesets numbers and units consistently, which avoids a whole class of small inconsistencies. And every equation, figure and chapter has a label, so cross-references update themselves when the thesis is reorganized. Write label references and citation commands, never hard-coded numbers such as Figure 3, because the numbers will change.
Planning the writing
The most common way an honours thesis goes wrong is not bad physics but running out of time to write about it. Writing always takes longer than expected, and it cannot be done well in the last two weeks. The remedy is to write throughout the project. Maya's plan from lesson 5 gave seven weeks to writing, but she had started long before: her proposal became the first draft of the introduction, her reading log the basis of the background chapter, and her notebook entries on the apparatus and calibrations the skeleton of the methods chapter. By the time the final data were analysed, about half the thesis existed in draft. A word budget, like the one below, helps to keep each chapter in proportion and shows where the remaining work lies.
budget = {   # chapter: (target words, words drafted by 1 March)
    "abstract":     (200,  0),
    "introduction": (1500, 1100),
    "theory":       (3500, 3200),
    "methods":      (3500, 2900),
    "results":      (3000, 600),
    "discussion":   (2000, 0),
    "conclusion":   (500,  0),
}
target = sum(t for t, _ in budget.values()); done = sum(d for _, d in budget.values())
print(f"target {target} words, drafted {done} ({done/target:.0%})")
weeks_left, rate = 6, 0
remaining = target - done
print(f"remaining {remaining} words over {weeks_left} weeks, with two weeks kept for revision:"
      f" about {remaining/(weeks_left - 2):.0f} new words per week")
for ch, (t, d) in sorted(budget.items(), key=lambda kv: -(kv[1][0] - kv[1][1])):
print(f" {ch:12s} {d:5d} of {t:5d} still to write {t - d:5d}")target 14200 words, drafted 7800 (55%) remaining 6400 words over 6 weeks, with two weeks kept for revision: about 1600 new words per week results 600 of 3000 still to write 2400 discussion 0 of 2000 still to write 2000 methods 2900 of 3500 still to write 600 conclusion 0 of 500 still to write 500 introduction 1100 of 1500 still to write 400 theory 3200 of 3500 still to write 300 abstract 0 of 200 still to write 200
Revision matters as much as drafting. Give your supervisor the full draft at least three weeks before the deadline, and agree on how long they need to read it. Read your own draft on paper or aloud; both expose awkward sentences and gaps in logic that the screen hides. Check every number in the text against the code that produced it, and every reference against its source. Ask a classmate outside your field to read the introduction and conclusion; if they cannot say what you did and what you found, an examiner may struggle too. Finally, proofread the figures and captions separately, because errors there are both common and conspicuous.
Worked problem
Improving a results paragraph
A draft reads: As can be clearly seen in Fig. 4, the model is very good, with all the points very close to the line, which obviously shows that the theory works. Rewrite it.
Show solution
- Remove the intensifiers clearly, very and obviously, and the vague phrase very close.
- State what the figure shows with numbers: the ratios of measured to predicted speed for the five pipes.
- Give the comparison quantitatively, with uncertainties and the relevant test.
- Separate the result from the interpretation, and use a label reference rather than a hard-coded figure number.
Answer: The comparison figure (cited in the source by its label) shows that the measured speeds are 0.968 to 0.977 of the finite-magnet predictions in all five pipes. The ratios are consistent with a common value of \(0.973 \pm 0.007\) (chi-squared 0.2 for 4 degrees of freedom), which differs from 1 by about one standard uncertainty of the shared inputs.
Common mistakes
MistakeWriting the thesis in the last month.
InsteadWrite throughout: proposal to introduction, reading log to background, notebook to methods.
MistakeMixing results and interpretation in every paragraph.
InsteadPresent what was measured, then discuss what it means.
MistakeFigures without units, error bars or a stated point.
InsteadUse the figure checklist: point, axes, uncertainties, models, legibility, reproducibility.
MistakeQuoting more significant figures than the uncertainty supports.
InsteadRound results and uncertainties consistently, such as 5.32 plus or minus 0.02 cm/s.
MistakeHard-coding figure and equation numbers.
InsteadUse labels and references so numbers update automatically.
Summary and key terms
- A physics thesis has an abstract, introduction, background, methods, results, discussion, conclusion, references and appendices, and its parts must answer each other.
- The abstract states question, method, main numbers and conclusion; the introduction ends with the main result; methods allow repetition; results and discussion are kept distinct.
- Each figure makes one point, with labelled axes, defined error bars, clear data and model distinctions, and reproducible code.
- Write clearly and economically, keep terms and notation consistent, punctuate equations and match significant figures to uncertainties.
- Use LaTeX with BibTeX and labels, keep the source with the analysis code, write throughout the project and leave time for revision.
- Abstract
- A summary of about 200 words stating question, method, results and conclusion.
- Residual plot
- A plot of data minus model, or data over model, that reveals systematic trends.
- LaTeX
- The document preparation system used for most physics writing.
- Cross-reference
- A label-based reference to an equation, figure or section that updates automatically.
- Word budget
- A plan of target lengths for each chapter, used to track progress.
Practice problems
Work each problem on paper first, then reveal the answer to check.
Rewrite "the speed was 5.31942 plus or minus 0.0213 cm/s" correctly.
Show answer
5.32 plus or minus 0.02 cm/s.
What should the last paragraph of the introduction contain?
Show answer
The question, how the thesis answers it and its main result.
Why plot residuals as well as data and model?
Show answer
Residuals reveal systematic trends that are hard to see when data and model are plotted on a large scale.
In the word budget, which chapters should Maya draft first?
Show answer
Results and discussion, where most of the remaining words lie, since the other chapters are largely drafted.
Give one reason to keep the thesis source in the same repository as the analysis code.
Show answer
Figures and numbers can be regenerated and included automatically, so the thesis always matches the analysis.
Lesson quiz · 5 questions
Score 60% or more to complete this lesson.
Create a free account to save your progress, take quizzes and earn a certificate.