
PHYS-397 · Lesson 9 of 12 · 21 min
Classic experiments II: photoelectric effect, Franck–Hertz and Planck's constant
Two experiments of the early twentieth century made the quantum unavoidable. The photoelectric effect showed that light delivers its energy in lumps proportional to its frequency, and gave a direct measurement of Planck's constant. The Franck–Hertz experiment showed that atoms absorb energy from colliding electrons only in definite amounts, confirming that atomic energy levels are discrete. PHYS-271 presented these results as part of the story of modern physics. This lesson looks at them as experiments: what is actually measured, what can go wrong, and how to extract \(h\) and an excitation energy from real-looking data with honest uncertainties.
The photoelectric effect
Heinrich Hertz noticed in 1887 that ultraviolet light made sparks jump more easily between electrodes. Philipp Lenard showed around 1902 that light ejects electrons from metal surfaces, and found a puzzle: the maximum energy of the ejected electrons did not depend on the intensity of the light, only on its frequency, and below a threshold frequency no electrons emerged at all, however bright the light. In 1905 Albert Einstein proposed that light itself consists of quanta of energy \(hf\). An electron absorbs a single quantum and escapes with at most the energy left after paying the work function \(W\) of the surface:
This explained everything Lenard saw: more intense light means more photons and more electrons, but not more energetic ones, and photons with \(hf < W\) cannot free any electron. It also made a bold prediction: a graph of \(K_{\max}\) against \(f\) should be a straight line with slope \(h\), the same for every metal. Robert Millikan, who doubted the photon idea, spent a decade testing it, and in 1916 published measurements that confirmed the linear relation and gave \(h\) to within about half a part in 100. Einstein's Nobel Prize of 1921 was awarded for this law, and Millikan's of 1923 in part for testing it.
Measuring the stopping potential
In the teaching version, light from a mercury lamp passes through a filter or monochromator that selects one spectral line and falls on a photocathode in a vacuum tube. Electrons ejected from the cathode travel to an anode. A retarding voltage applied to the anode repels them, and the photocurrent falls as the voltage rises. At the stopping potential \(V_s\), even the fastest electrons are turned back and the current drops to zero:
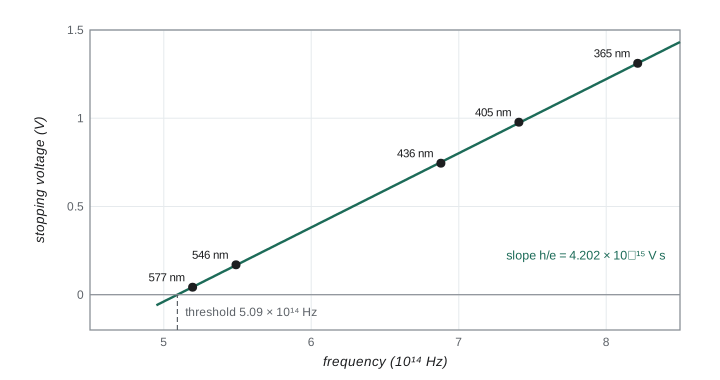
A plot of \(V_s\) against \(f\) has slope \(h/e\) and intercept \(-W/e\). Mercury lamps are convenient because their bright lines at 365.0, 404.7, 435.8, 546.1 and 577.0 nm span a factor of 1.6 in frequency. Several experimental problems make the measurement harder than the equation suggests. The current near the stopping potential approaches zero gradually rather than abruptly, because the electrons have a spread of energies, so locating \(V_s\) needs a definite criterion applied the same way at every wavelength. Light scattered onto the anode ejects electrons from it, giving a small reverse current that masks the true zero. The anode and cathode are made of different metals, so a contact potential of order a volt adds to the applied voltage. This last effect shifts the intercept and so the apparent work function, but not the slope, which is why \(h\) can be measured well even when \(W\) cannot.
Fitting the data, and an honest uncertainty
The program simulates the five mercury lines on a cathode whose effective work function, including contact potential, is 2.10 eV, with a reading uncertainty of 0.02 V on each stopping voltage. It fits a straight line, then estimates the uncertainty of the slope in two ways: from the known reading uncertainty, and from the scatter of the points about the line.
import math, random
random.seed(397)
h_true, e, c = 6.62607015e-34, 1.602176634e-19, 299792458.0
# 1. Photoelectric effect with the mercury lines; cathode work function about 2.10 eV (plus contact potential).
lines_nm = [365.0, 404.7, 435.8, 546.1, 577.0]
W = 2.10
data = []
for lam in lines_nm:
    f = c/(lam*1e-9)
    Vs = h_true*f/e - W + random.gauss(0, 0.02)       # stopping voltage, 0.02 V reading uncertainty
    data.append((f, Vs))
n = len(data); mf = sum(f for f, _ in data)/n; mv = sum(v for _, v in data)/n
Sff = sum((f - mf)**2 for f, _ in data); slope = sum((f - mf)*(v - mv) for f, v in data)/Sff
icpt = mv - slope*mf
res = [v - (icpt + slope*f) for f, v in data]
s = math.sqrt(sum(r*r for r in res)/(n - 2))
h = slope*e; dh = 0.02/math.sqrt(Sff)*e; dh_res = s/math.sqrt(Sff)*e
chi2 = sum((r/0.02)**2 for r in res)
print("frequency (1e14 Hz) and stopping voltage (V):", ", ".join(f"{f/1e14:.3f}: {v:.3f}" for f, v in data))
print(f"h = {h:.4e} +/- {dh:.1e} J s from the 0.02 V reading uncertainty (accepted 6.6261e-34)")
print(f"   the residual scatter alone would suggest +/- {dh_res:.1e}; chi-squared = {chi2:.2f} for 3 dof")
print(f"work function = {-icpt:.3f} eV; threshold frequency {-icpt*e/h/1e14:.3f}e14 Hz")
# 2. Franck-Hertz curve for mercury: collector current versus accelerating voltage.
Eexc, Vc = 4.89, 2.1          # first excitation energy (eV) and contact potential offset (V)
def current(V):
    x = V - Vc
    if x <= 0: return 0.0
    k = math.floor(x/Eexc); r = x - k*Eexc           # energy left after k inelastic collisions
    return (x**1.5)*(0.25 + 0.75*(1 - math.exp(-r/0.9)))*math.exp(-0.04*k)
Vs = [i*0.05 for i in range(0, 601)]
I = [current(V) + random.gauss(0, 0.05) for V in Vs]
sm = [sum(I[max(0, i - 3):i + 4])/len(I[max(0, i - 3):i + 4]) for i in range(len(I))]   # 7-point smoothing
peaks = [Vs[i] for i in range(10, len(sm) - 10) if sm[i] == max(sm[i - 10:i + 11]) and Vs[i] > 4]
print("peak voltages (V):", ", ".join(f"{p:.2f}" for p in peaks))
sp = [b - a for a, b in zip(peaks, peaks[1:])]
print(f"mean spacing {sum(sp)/len(sp):.2f} V -> excitation energy {sum(sp)/len(sp):.2f} eV, photon wavelength {h_true*c/(sum(sp)/len(sp)*e)*1e9:.0f} nm")frequency (1e14 Hz) and stopping voltage (V): 8.213: 1.311, 7.408: 0.977, 6.879: 0.745, 5.490: 0.169, 5.196: 0.043 h = 6.7327e-34 +/- 1.3e-35 J s from the 0.02 V reading uncertainty (accepted 6.6261e-34) the residual scatter alone would suggest +/- 2.8e-36; chi-squared = 0.14 for 3 dof work function = 2.140 eV; threshold frequency 5.092e14 Hz peak voltages (V): 6.80, 11.70, 16.60, 21.50, 26.35 mean spacing 4.89 V -> excitation energy 4.89 eV, photon wavelength 254 nm
The fit gives \(h = (6.73 \pm 0.13) \times 10^{-34}\) J s when the uncertainty is based on the known 0.02 V reading error, in agreement with the accepted \(6.626 \times 10^{-34}\) J s at 0.8 standard uncertainties. Now look at what happens with the other estimate. By chance, the five points lie unusually close to the line, so the residual scatter suggests an uncertainty five times smaller, \(\pm 0.028 \times 10^{-34}\), which would make the result appear to disagree with the accepted value by almost four standard uncertainties. The chi-squared of 0.14 for three degrees of freedom flags the problem: it is improbably small. With only five points and two parameters, the scatter is a poor estimate of the true uncertainty. When you know the measurement uncertainty from the instrument and the method, use it, and use chi-squared to check it; do not replace a well-founded uncertainty with the scatter of a handful of points.
The Franck–Hertz experiment
In 1914 James Franck and Gustav Hertz, a nephew of Heinrich, accelerated electrons through mercury vapour and measured how many reached a collector. Electrons leave a heated cathode, are accelerated toward a grid by a voltage \(V\), and those that pass the grid must overcome a small retarding voltage, about half a volt, to reach the collector. Plotting collector current against accelerating voltage, Franck and Hertz saw the current rise, then drop sharply at intervals of about 4.9 V, rise again, drop again, in a series of regularly spaced peaks.
The explanation is that a mercury atom can absorb energy from a colliding electron only if the electron has at least 4.9 eV, the energy of the atom's first excited state. Below that, collisions are elastic: a light electron bouncing off a heavy atom loses almost no energy. When the accelerating voltage reaches 4.9 V, electrons gain enough energy just in front of the grid to excite an atom, lose almost all their energy, and can no longer climb the retarding voltage: the current drops. Raise the voltage further and the electrons gain 4.9 eV well before the grid, lose it, and are reaccelerated; at 9.8 V they can excite two atoms in succession, and so on. The spacing of the peaks measures the excitation energy directly. Franck and Hertz also saw the excited mercury atoms emit ultraviolet light at 253.7 nm, the wavelength corresponding to 4.89 eV, confirming the interpretation. They shared the Nobel Prize in 1925. The experiment was the first direct evidence for Niels Bohr's discrete atomic energy levels, proposed in 1913, although Franck and Hertz at first interpreted their result as ionization.
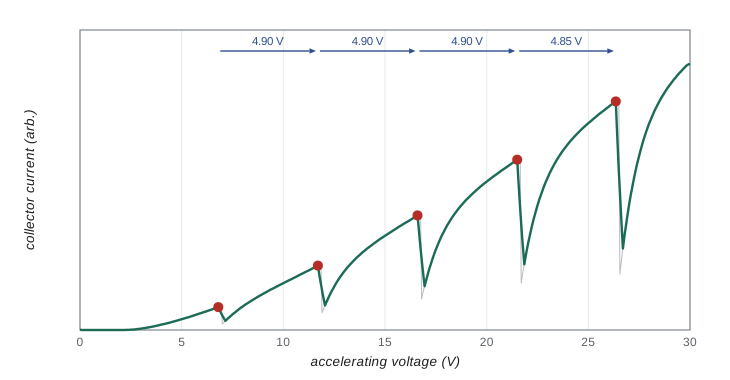
Two details matter in practice. The first peak is not at 4.9 V but higher, because the contact potential between the cathode and grid adds to the applied voltage; the spacing between peaks is unaffected, which is why it, not the position of the first peak, is the measured quantity. And the peaks are rounded, not sharp, because the electrons leave the cathode with a spread of thermal energies and because some electrons excite higher levels. Measuring all the peak positions and fitting them against peak number gives the spacing with an uncertainty, and checks that it is constant. The simulated curve, with a contact potential of 2.1 V and noise added, gives peaks at 6.80, 11.70, 16.60, 21.50 and 26.35 V, a mean spacing of 4.89 V, and a predicted emission wavelength of 254 nm. Smoothing over seven points before finding the peaks prevents noise from producing false maxima; a more careful analysis would fit a smooth function near each peak.
Planck's constant then and now
Max Planck introduced \(h\) in 1900 to explain the spectrum of blackbody radiation, as a mathematical device he hoped to remove. The photoelectric effect and spectroscopy made it physical. Its value was measured by many methods over the century: the photoelectric effect, X-ray spectra, the Josephson effect in superconductors and the watt balance, now called the Kibble balance after Bryan Kibble, which compares mechanical and electrical power so precisely that it could weigh a kilogram in terms of \(h\). The National Research Council of Canada's Kibble balance made one of the most precise measurements, with an uncertainty of about 9 parts in a billion, and contributed to fixing \(h = 6.62607015 \times 10^{-34}\) J s exactly in the 2019 redefinition of the kilogram. A student photoelectric measurement good to 2 parts in 100 is part of the same story.
Worked problem
Planck's constant from two lines
Stopping voltages of 1.29 V and 0.18 V are measured for the 365.0 nm and 546.1 nm mercury lines, each to \(\pm 0.02\) V. Find h, the work function, and the uncertainty in h.
Show solution
- Frequencies: \(c/\lambda = 8.214 \times 10^{14}\) Hz and \(5.490 \times 10^{14}\) Hz; difference \(2.724 \times 10^{14}\) Hz.
- Slope: \((1.29 - 0.18)/2.724 \times 10^{14} = 4.075 \times 10^{-15}\) V s, so \(h = 1.602 \times 10^{-19} \times 4.075 \times 10^{-15} = 6.53 \times 10^{-34}\) J s.
- Uncertainty of the voltage difference: \(\sqrt{2} \times 0.02 = 0.028\) V, or 2.5 parts in 100 of 1.11 V, so \(\sigma_h = 0.17 \times 10^{-34}\) J s.
- Work function: \(W = hf - eV_s = 6.53 \times 10^{-34} \times 5.490 \times 10^{14}/1.602 \times 10^{-19} - 0.18 = 2.06\) eV.
Answer: \(h = (6.5 \pm 0.2) \times 10^{-34}\) J s, consistent with the accepted value; the effective work function, including the contact potential, is about 2.1 eV.
Common mistakes
MistakeExpecting brighter light to raise the stopping potential.
InsteadIntensity changes the number of electrons, not their maximum energy.
MistakeReading the work function directly from the intercept.
InsteadThe intercept includes the contact potential between cathode and anode.
MistakeLocating the stopping potential by different criteria at different wavelengths.
InsteadApply one definite criterion to every curve.
MistakeUsing the position of the first Franck–Hertz peak as the excitation energy.
InsteadUse the spacing between peaks; the first is shifted by the contact potential.
MistakeTrusting a residual-based uncertainty from a few points.
InsteadWith few points, use the known measurement uncertainty and check it with chi-squared.
Summary and key terms
- Einstein (1905): \(K_{\max} = hf - W\); intensity changes the number, not the energy, of photoelectrons.
- \(V_s = (h/e)f - W/e\): the slope gives h; contact potentials shift only the intercept.
- Millikan confirmed the law in 1916; mercury lines span a convenient range of frequencies.
- Franck and Hertz (1914): current drops at intervals of the first excitation energy, 4.9 eV for mercury.
- Measure the spacing of Franck–Hertz peaks, not the position of the first peak.
- Since 2019, h is fixed exactly at \(6.62607015 \times 10^{-34}\) J s.
- photoelectric effect
- The ejection of electrons from a surface by light.
- work function
- The minimum energy needed to remove an electron from a surface.
- stopping potential
- The retarding voltage that just stops the most energetic photoelectrons.
- contact potential
- The voltage difference between two different metals in electrical contact.
- excitation energy
- The energy needed to raise an atom from its ground state to an excited state.
- Kibble balance
- An instrument that relates mass to Planck's constant through electrical measurements.
Practice problems
Work each problem on paper first, then reveal the answer to check.
Light of wavelength 400 nm falls on a surface with work function 2.3 eV. Find the stopping potential.
Show answer
\(hf = 1240/400 = 3.10\) eV, so \(V_s = 0.80\) V.
Find the threshold wavelength for a cathode with work function 2.10 eV.
Show answer
\(\lambda = 1240/2.10 = 590\) nm.
A Franck–Hertz curve for neon shows peaks spaced by 18.7 V. What wavelength of light would the excited atoms emit if they returned directly to the ground state?
Show answer
\(1240/18.7 = 66\) nm, in the far ultraviolet.
Why does the contact potential not affect the measured value of h?
Show answer
It adds the same voltage at every frequency, shifting the line without changing its slope.
Five stopping voltages give a fit with \(\chi^2 = 12\) for 3 degrees of freedom. What should you suspect?
Show answer
p is about 0.007: the reading uncertainty is underestimated or a systematic effect, such as anode emission, varies with wavelength.
Why do Franck–Hertz peaks occur at regular intervals rather than once?
Show answer
Electrons that excite an atom are reaccelerated and can excite another atom each time they regain the excitation energy.
Lesson quiz · 5 questions
Score 60% or more to complete this lesson.
Create a free account to save your progress, take quizzes and earn a certificate.