
PET-450 · Lesson 9 of 12 · 18 min
Economic indicators and capital budgeting
By early December the reserves forecasts are in draft, and the same models are needed for a second purpose: next year's capital budget. The board has approved spending of 45 million Canadian dollars in 2027, and the engineering teams have proposed seven projects that together would cost almost twice that. Diane asks Ethan to rank them. “Every team thinks its project is the best one. Your job is to show which combination gives the company the most value for the money it has, and to explain the answer so the teams that lose out can accept it.” This lesson covers the economic indicators used to compare projects, their strengths and traps, and how to choose a portfolio under a capital limit.
The main indicators
Several indicators summarize a project's cash flow, and each answers a different question.
| Indicator | Definition | Question it answers | Main weakness |
|---|---|---|---|
| NPV | Sum of discounted net cash flows | How much value does the project add? | Ignores the capital needed to earn it |
| IRR | Discount rate at which NPV = 0 | What return does the capital earn? | Ignores scale; can mislead for unusual cash flows |
| Profit-to-investment ratio (PIR) | NPV / discounted capital | How much value per dollar invested? | Needs a clear definition of capital |
| Payout | Time to recover capital from undiscounted cash flow | How long is capital at risk? | Ignores cash after payout |
| Discounted payout | Payout using discounted cash flow | When is the investment recovered with interest? | Still ignores later cash |
| Capital efficiency | Capital per unit of reserves or of initial production | How much does it cost to add a barrel or a barrel per day? | Ignores price and timing |
NPV is the fundamental measure of value: if the discount rate is the company's true cost of capital, a project with a positive NPV increases the company's value by that amount. When capital is unlimited, the company should do every project with a positive NPV. The IRR is popular because it is a rate that can be compared with the cost of capital without choosing a discount rate first, but it ignores the size of the project: a 3 million dollar project with an 80 percent IRR may add far less value than a 30 million dollar project with a 40 percent IRR.
The IRR also has technical problems. A cash flow with more than one change of sign, such as a project with a large abandonment cost at the end, can have more than one IRR or none at all. And when two mutually exclusive projects are compared, the one with the higher IRR is not necessarily the one with the higher NPV. The profit-to-investment ratio, also called the discounted return on investment or capital efficiency ratio, measures value per dollar of capital and is the most useful indicator when capital is limited.
Ethan's project list
The seven proposals come from the earlier lessons and from PET-430. The Phase 2 values are the after-tax values of Lesson 8. The Spruce Ridge exploration well is valued by its risked expected monetary value, explained in Lesson 10, because it may find nothing. The CO2 pilot has a negative stand-alone NPV but is proposed because it would test the much larger contingent CO2 project of Lesson 2.
# Capital budgeting: rank the projects competing for next year's budget and pick the best set.
from itertools import combinations
SI = True      # True: Canadian dollars, False: US dollars (the project list is the same)
cur = "C" if SI else "US"
# name: (capital, after-tax NPV10, IRR), millions; the exploration well is valued by its risked EMV (Lesson 10)
if SI:
    P = {"Phase 2, wells 5-8":          (20.8, 16.3, 0.55),
         "north flank, first 3 wells":  (16.8, 6.0, 0.28),
         "waterflood expansion":        (14.0, 9.6, 0.29),
         "CO2 WAG pilot":               (8.0, -1.5, 0.06),
         "Birch Coulee compression":    (3.2, 4.1, 0.65),
         "east flank appraisal well":   (6.5, 1.2, 0.13),
         "Spruce Ridge exploration":    (4.8, 3.3, None)}
    budget = 45.0
else:
    P = {"Phase 2, wells 5-8":          (28.0, 20.6, 0.41),
         "north flank, first 3 wells":  (22.5, 7.5, 0.25),
         "waterflood expansion":        (14.0, 7.2, 0.24),
         "CO2 WAG pilot":               (8.0, -3.0, 0.02),
         "Birch Coulee compression":    (3.2, 4.1, 0.65),
         "east flank appraisal well":   (6.5, 1.2, 0.13),
         "Spruce Ridge exploration":    (5.5, 1.6, None)}
    budget = 55.0
print(f"{'project':28s} capital  NPV10   PIR   IRR  ({cur} dollars, millions; budget {budget:.0f})")
for n, (c, v, i) in sorted(P.items(), key=lambda kv: -kv[1][1] / kv[1][0]):
    print(f"{n:28s} {c:6.1f} {v:6.1f} {v / c:5.2f} " + (f"{i:5.0%}" if i is not None else "  EMV"))
def pick(key):
    chosen, spent = [], 0.0
    for n, (c, v, i) in sorted(P.items(), key=key):
        if v > 0 and spent + c <= budget: chosen.append(n); spent += c
    return chosen, spent, sum(P[n][1] for n in chosen)
for label, key in (("by NPV", lambda kv: -kv[1][1]), ("by IRR", lambda kv: -(kv[1][2] if kv[1][2] is not None else 0)), ("by PIR", lambda kv: -kv[1][1] / kv[1][0])):
    ch, s, v = pick(key); print(f"rank {label:7s}: spend {s:5.1f}, total NPV10 {v:5.1f} ({len(ch)} projects)")
best = max((sum(P[n][1] for n in s), s) for k in range(len(P) + 1) for s in combinations(P, k) if sum(P[n][0] for n in s) <= budget)
print(f"best possible set within {budget:.0f}: NPV10 {best[0]:.1f}, capital {sum(P[n][0] for n in best[1]):.1f}")
print("  " + ", ".join(best[1]))
# mutually exclusive designs: incremental analysis between a small and a large waterflood expansion
k = 1.0 if SI else 0.9                         # the US expansion has a higher royalty burden
A = [-14.0] + [k * x for x in (5.6, 5.4, 4.8, 4.1, 3.5, 3.0, 2.6, 2.2, 1.9, 1.6)]   # design A: 6 injector conversions
B = [-22.0] + [k * x for x in (7.4, 7.4, 6.8, 6.0, 5.2, 4.5, 3.9, 3.4, 2.9, 2.5)]   # design B: 6 conversions + 3 new injectors
npv = lambda c, r: sum(x / (1 + r) ** t for t, x in enumerate(c))
def irr(c):
    lo, hi = -0.9, 2.0
    for _ in range(100):
        m = (lo + hi) / 2
        lo, hi = (m, hi) if npv(c, m) > 0 else (lo, m)
    return lo
inc = [b - a for a, b in zip(A, B)]
print(f"waterflood design A: NPV10 {npv(A, .1):.1f}, IRR {irr(A):.0%}")
print(f"waterflood design B: NPV10 {npv(B, .1):.1f}, IRR {irr(B):.0%}")
print(f"increment B - A: capital {-inc[0]:.1f}, NPV10 {npv(inc, .1):.1f}, IRR {irr(inc):.0%}")project capital NPV10 PIR IRR (C dollars, millions; budget 45) Birch Coulee compression 3.2 4.1 1.28 65% Phase 2, wells 5-8 20.8 16.3 0.78 55% Spruce Ridge exploration 4.8 3.3 0.69 EMV waterflood expansion 14.0 9.6 0.69 29% north flank, first 3 wells 16.8 6.0 0.36 28% east flank appraisal well 6.5 1.2 0.18 13% CO2 WAG pilot 8.0 -1.5 -0.19 6% rank by NPV : spend 42.8, total NPV10 33.3 (4 projects) rank by IRR : spend 44.5, total NPV10 31.2 (4 projects) rank by PIR : spend 42.8, total NPV10 33.3 (4 projects) best possible set within 45: NPV10 33.3, capital 42.8 Phase 2, wells 5-8, waterflood expansion, Birch Coulee compression, Spruce Ridge exploration waterflood design A: NPV10 9.6, IRR 29% waterflood design B: NPV10 11.6, IRR 24% increment B - A: capital 8.0, NPV10 2.0, IRR 16%
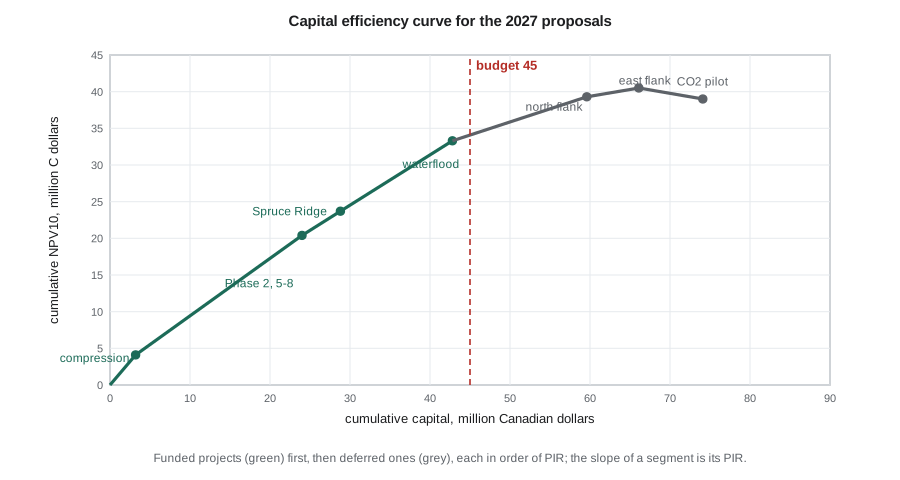
Ranking by PIR, Ethan fills the budget with the compressor for the Birch Coulee gas pool, the four remaining Phase 2 wells, the Spruce Ridge exploration well and the waterflood expansion, which together cost 42.8 million and add 33.3 million of NPV. A search of every possible combination confirms that no other set within the budget adds more. Ranking by NPV happens to give the same set here, but ranking by IRR does not: because the exploration well has no IRR, the IRR ranking replaces it with the east flank appraisal well and loses 2.1 million of value.
Capital rationing
In theory a company could raise more capital for every project with a positive NPV. In practice budgets are limited by cash flow, debt covenants, shareholders' expectations of dividends and buybacks, and the capacity of the organization to carry out work. Under such capital rationing, the objective is to choose the set of projects that maximizes total NPV within the budget. When projects are divisible, ranking by PIR and funding them in order is optimal. When they are not, as with a compressor that must be bought whole, ranking by PIR is usually close to optimal but not always, and a search of combinations, as in the script, or a simple integer optimization finds the true best set.
The ranking also shows the cost of the budget limit. The last project funded and the first project deferred mark the marginal PIR, the value the company would gain from one more dollar of capital. If the marginal PIR is high, the board may decide to borrow, sell a non-core asset or issue equity to fund more projects. If it is low, the company may do better to return cash to shareholders. Ethan's chart is the most useful single picture he will present to the board.
Mutually exclusive alternatives
Some choices are between alternatives where only one can be done, such as two designs of the same waterflood expansion. Design A converts six producers to injection for 14 million dollars. Design B also drills three new injectors for a total of 22 million and recovers more oil. Design A has the higher IRR, but design B has the higher NPV. The correct comparison is incremental: treat the extra spending of B over A as a project of its own. If the incremental cash flow has a positive NPV at the company's discount rate, or equivalently an incremental IRR above it, B is better when capital is unlimited.
In the script the increment costs 8 million dollars and has an NPV10 of 2.0 million and an IRR of 16 percent, so with unlimited capital design B is preferred. Under the budget limit the answer changes. The increment's PIR is 0.25, below the 0.36 of the north flank wells, which are already deferred, so the extra 8 million would add less value than other uses of capital, and design A stays in the plan. The general rule is that, under capital rationing, every increment must compete with every other use of the money.
Worked problem
Incremental analysis
Project X costs 10 million and has an NPV10 of 6 million and an IRR of 45 percent. Project Y, which uses the same location, costs 18 million and has an NPV10 of 9 million and an IRR of 32 percent. Which should be chosen with unlimited capital, and what does the increment look like?
Show solution
- The increment Y − X costs 18 − 10 = 8 million and adds 9 − 6 = 3 million of NPV10.
- The incremental PIR is 3 / 8 = 0.375, and the incremental NPV is positive, so its IRR exceeds 10 percent.
- With unlimited capital, Y is better because it adds more total value, despite its lower IRR.
Answer: Under a budget, the 8 million increment should be compared with other projects; it should be funded only if its PIR of 0.375 is at least as high as the marginal project's.
Beyond the numbers
Some projects are worth more than their stand-alone NPV because of what they make possible. The CO2 pilot has a negative NPV of its own, but a successful pilot would turn a large contingent resource into reserves; its value lies in the information and the option it creates, which Lesson 11 quantifies. Appraisal wells are similar. Strategic projects, such as a gas plant expansion that secures processing capacity for a growing area, may also be justified on a portfolio rather than a well-by-well basis. Diane's advice is to show such projects honestly: report the stand-alone NPV, state the strategic or option value separately with its assumptions, and let the board decide.
Risk also matters. Two projects with the same NPV and PIR are not equally attractive if one has a narrow range of outcomes and the other a wide one, or if one depends on a single uncertain variable such as the oil price and the other does not. A budget built entirely from the highest-PIR projects may concentrate risk in one area or one play. The next two lessons develop the tools for measuring risk, and Lesson 12 returns to the plan as a whole.
Finally, budgets are not one-time decisions. Prices, costs and results change during the year, and the ranking should be updated when they do. Ethan sets up the ranking so that it can be rerun each quarter with new prices and well results, and recommends that the deferred projects be kept ready, with permits and engineering in place, so that the company can move quickly if more capital becomes available.
Common mistakes
MistakeChoosing between projects by IRR alone.
InsteadUse NPV for value and PIR under a capital limit; IRR ignores scale.
MistakeChoosing between mutually exclusive designs by the higher IRR.
InsteadAnalyse the increment; it must have a positive NPV and compete with other uses of capital.
MistakeFunding projects in order of NPV under a budget.
InsteadRank by PIR or optimize the combination to maximize total NPV within the budget.
MistakeIgnoring the option value of pilots and appraisal.
InsteadReport stand-alone NPV and the value of the information separately.
Summary and key terms
- NPV measures value; IRR measures return on capital; PIR measures value per dollar invested.
- With unlimited capital, every positive-NPV project adds value.
- Under capital rationing, ranking by PIR or optimizing the combination maximizes total NPV.
- The marginal PIR shows the value of additional capital.
- Mutually exclusive alternatives are compared by incremental analysis.
- Pilots and appraisal projects carry option and information value beyond their stand-alone NPV.
- Capital rationing
- A limit on capital that prevents a company from funding every positive-NPV project.
- Marginal PIR
- The PIR of the last project funded, showing the value of additional capital.
- Mutually exclusive projects
- Alternatives of which only one can be carried out.
- Incremental analysis
- Evaluating the difference in cash flow between two alternatives.
- Discounted payout
- The time for cumulative discounted cash flow to recover the capital.
- Option value
- The value of the flexibility to make a later decision after new information.
Practice problems
Work each problem on paper first, then reveal the answer to check.
Project P has an NPV of 2 million on capital of 4 million; project Q has 5 million on capital of 20 million. Which has the higher PIR?
Show answer
P: 0.50 against Q's 0.25.
Why can a project with a large abandonment cost have more than one IRR?
Show answer
Its cash flow changes sign more than once.
With a budget of 10 million and projects A (6 million, NPV 4), B (5 million, NPV 3) and C (4 million, NPV 2.5), which set is best?
Show answer
A and C: 10 million for 6.5 of NPV, more than B and C (9 million for 5.5); A and B would exceed the budget.
What does a high marginal PIR suggest to the board?
Show answer
Additional capital would add significant value, so raising more may be worthwhile.
Lesson quiz · 5 questions
Score 60% or more to complete this lesson.
Create a free account to save your progress, take quizzes and earn a certificate.