
NUC-310 · Lesson 9 of 12 · 19 min
In-core and ex-core reactor instrumentation
A power reactor's neutron flux spans more than ten decades between a cold shutdown core and full power. No single detector can cover that range, and the instruments that do must be reliable enough to shut the reactor down automatically if something goes wrong. Dr. Vasquez's group, which Hana rejoins for this lesson, owns the physics behind those instruments: how they are calibrated, how their readings are compared with predictions, and what they can and cannot tell the operators.
Covering ten decades
Reactor neutron instrumentation is divided into overlapping ranges, each using a detector suited to it. At the lowest powers, during start-up and shutdown, the source range uses pulse-counting detectors, BF₃ or boron-lined proportional counters or fission chambers, which count individual neutrons from the installed start-up source and from subcritical multiplication. In the intermediate range, compensated ion chambers or fission chambers in Campbell mode measure flux as a current or as a variance of the signal. In the power range, uncompensated ion chambers or fission chambers in current mode measure flux proportional to power.
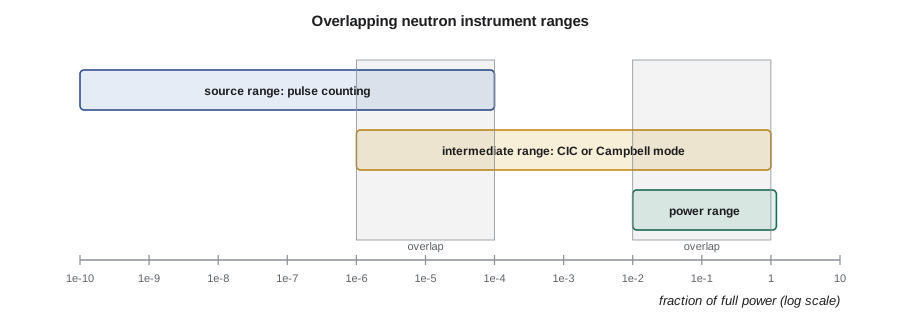
The ranges must overlap by at least one decade, so that operators always have a valid indication and the protection system can transfer from one range to the next. Source-range detectors are switched off or their high voltage removed above a set power, because the high flux would damage them or shorten their life. As power falls during shutdown, they are switched back on before the intermediate range loses its signal.
# Reactor instrumentation: detector ranges, log power and start-up rate, and SPND burnup.
import math
ranges = [('source range (BF3 or fission counter)', 1e-9, 1e-4),
          ('intermediate range (compensated ion chamber)', 1e-6, 1e0),
          ('power range (uncompensated ion chamber)', 1e-2, 1.2)]
for name, lo, hi in ranges:
    print(f"{name:45s} {lo:7.0e} to {hi:7.0e} of full power ({math.log10(hi/lo):4.1f} decades)")

# Start-up rate in decades per minute from a stable period T: SUR = 26.06 / T
for T in (300, 120, 60, 30):
    print(f"period {T:4d} s -> start-up rate {26.06/T:5.2f} DPM; time for 3 decades {3/(26.06/T):5.1f} min")

# Burnup of a vanadium emitter SPND: sensitivity loss with fluence
sigma = 5.0e-24          # cm2, V-51 thermal capture (approx.)
for years in (1, 5, 10):
    fluence = 1e13 * 3.15e7 * years
print(f"{years:2d} years at 1e13: emitter remaining {100*math.exp(-sigma*fluence):6.2f} %")source range (BF3 or fission counter) 1e-09 to 1e-04 of full power ( 5.0 decades) intermediate range (compensated ion chamber) 1e-06 to 1e+00 of full power ( 6.0 decades) power range (uncompensated ion chamber) 1e-02 to 1e+00 of full power ( 2.1 decades) period 300 s -> start-up rate 0.09 DPM; time for 3 decades 34.5 min period 120 s -> start-up rate 0.22 DPM; time for 3 decades 13.8 min period 60 s -> start-up rate 0.43 DPM; time for 3 decades 6.9 min period 30 s -> start-up rate 0.87 DPM; time for 3 decades 3.5 min 1 years at 1e13: emitter remaining 99.84 % 5 years at 1e13: emitter remaining 99.22 % 10 years at 1e13: emitter remaining 98.44 %
Period and start-up rate
During an approach to criticality and the subsequent power increase, operators watch not only the power level but how fast it is rising. In lesson 10 of NUC-300 the reactor period \(T\) was defined as the time for power to rise by a factor of \(e\). Instruments often display the start-up rate (SUR) in decades per minute instead:
The constant is \(60/\ln 10\). A period of 60 s corresponds to a start-up rate of about 0.43 decades per minute, so three decades of power increase takes about seven minutes. Procedures limit the start-up rate during approach to power, and the protection system trips the reactor on short period or high rate of change of log power, in addition to high power. A log-power channel, using a logarithmic amplifier on an ion chamber current, provides both the power level over many decades and the rate of change.
Ex-core detectors
Ex-core detectors sit outside the core and its vessel or calandria, where temperatures and flux are lower, and where detectors can be reached and replaced. In a PWR, ex-core detectors are placed in wells in the concrete around the reactor vessel; their signals are dominated by neutrons leaking from the outer fuel assemblies near them. In a CANDU reactor, ion chambers are mounted on the side of the calandria vault, viewing the core through holes in the shielding.
Because ex-core detectors see only leakage neutrons, their signals depend on the power shape near the core edge as well as on total power. A change in the axial or radial power distribution, from control rod movement or xenon redistribution, can change the ex-core signal without a change in total power. That is why ex-core power-range channels are calibrated regularly against a heat balance, the thermal power calculated from feedwater flow and temperatures, and why PWRs use split detectors at the top and bottom of the core to measure axial power difference, or axial offset.
In CANDU reactors, the ion chambers used by the shutdown systems are independent for each system, consistent with the principle that the two shutdown systems share no instrumentation. Each shutdown system uses its own triplicated neutron and process trip channels.
In-core detectors
In-core detectors measure the flux inside the core itself. They provide the three-dimensional power distribution needed to confirm that local power stays within thermal limits, to check that fuel loading was done correctly, and, in some designs, to trip the reactor on local overpower. Self-powered neutron detectors (lesson 6) are the most common in-core sensors because they are small, need no bias supply and can be installed in large numbers.
Delayed-response emitters such as rhodium and vanadium are used for flux mapping, where accuracy matters more than speed. Their signals are processed to remove the delay, by modelling the emitter's activation and decay, so that a fast but noisier estimate of the instantaneous flux is available. Prompt-response emitters such as platinum, cobalt and inconel are used where speed matters, notably for regional overpower protection in CANDU reactors. Each SPND's sensitivity falls slowly as its emitter burns up; the program shows that a vanadium emitter loses only a fraction of a percent per year at a typical flux, while rhodium burns up much faster and must be corrected in software.
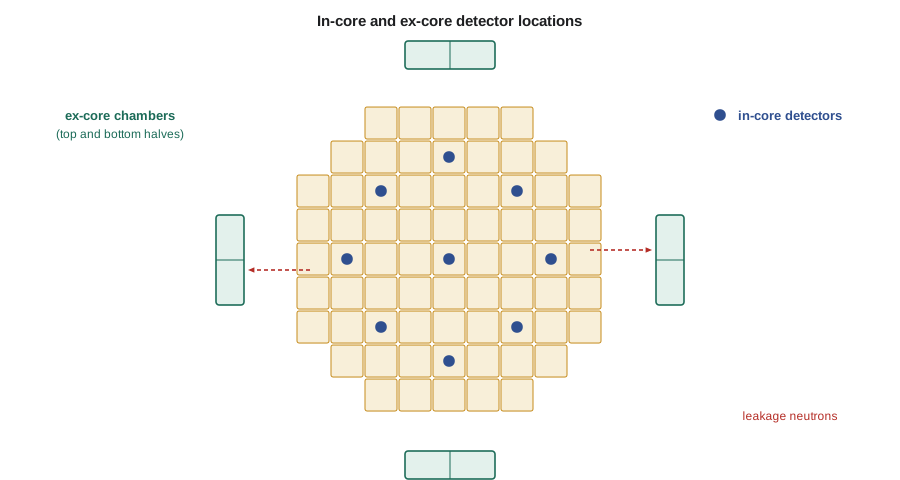
PWRs have used two main approaches. Older plants insert movable miniature fission chambers through guide tubes into instrument thimbles at the centre of selected fuel assemblies, driven from below on long cables, to record axial flux traces periodically. Many newer designs use fixed strings of rhodium SPNDs at several axial levels, giving continuous monitoring. BWRs use local power range monitors, strings of small fission chambers between fuel bundles, calibrated with traversing in-core probes. CANDU reactors install vertical and horizontal flux detector assemblies between the fuel channels in the moderator.
Flux mapping and the comparison with prediction
In-core readings are compared with the reactor physics model. The core-follow code predicts the flux at each detector location from the fuel burnup, control device positions and power level; the measured signals, corrected for sensitivity and burnup, are compared with these predictions, and the full three-dimensional power distribution is reconstructed by combining both. In a CANDU reactor, this flux mapping is done routinely to set the zone controller reference shape and to calibrate the regional overpower detectors.
Differences between measurement and prediction are tracked as trends. A single detector that reads high or low by a constant amount is usually a detector or cabling problem. A systematic pattern across several detectors may point to a mis-loaded fuel assembly, an incorrect burnup history or a model error. In either case the physics group investigates and, if needed, adjusts trip setpoints or model parameters. Hana's first task is to write a script that flags any detector whose ratio of measured to predicted signal changes by more than a set amount between maps.
Process instrumentation and core thermal limits
Neutron detectors measure flux, but the limits that protect fuel are thermal: fuel centreline temperature, cladding temperature and margin to critical heat flux or dryout. In-core flux measurements are therefore combined with thermocouples at fuel assembly or channel outlets, coolant flow and pressure measurements, and the reactor physics model, to calculate thermal margins continuously. Thermocouple maps provide an independent check on the power distribution, since outlet temperature rise is proportional to channel power divided by flow. NUC-330 develops these limits, and the control course develops how the measurements feed control and protection systems.
Calibration, testing and reliability
Reactor instrumentation channels are tested regularly. Channel checks compare redundant channels with each other. Functional tests inject simulated signals to confirm that alarms and trips work. Calibrations adjust the gain of power channels to match thermal power measured by a heat balance. Response time tests confirm that the signal reaches the trip logic fast enough. Detectors age, cables degrade in heat and radiation, and connectors corrode, so the trend of test results is as important as each individual pass.
Redundancy and voting logic protect against single failures. Protection channels are usually triplicated or quadruplicated and arranged so that one failed channel neither causes a spurious trip nor prevents a needed trip. Separation of cable routes and power supplies protects against common-cause failures such as fire. The design and qualification of these systems is a subject of its own, but the measurement physics underneath is the content of this course.
| Range | Detector | Mode | Main purpose |
|---|---|---|---|
| Source | BF₃ counter or fission chamber | Pulse counting | Start-up, shutdown monitoring, subcritical multiplication |
| Intermediate | Compensated ion chamber or fission chamber | Current or Campbell | Log power, period, start-up rate |
| Power (ex-core) | Uncompensated ion chamber | Current | Power level, protection, axial offset |
| In-core (delayed) | Rhodium or vanadium SPND | Current | Flux mapping |
| In-core (prompt) | Platinum, cobalt or inconel SPND | Current | Regional overpower, fast response |
| In-core (movable) | Miniature fission chamber | Pulse or current | Periodic axial flux traces |
Detector failure modes
Reactor instruments fail in recognizable ways, and operators and maintenance staff are trained to spot them. A source-range counter whose count rate suddenly drops to zero may have lost high voltage or suffered a broken cable. A count rate that rises sharply without any reactivity change can be electrical noise from welding or other work nearby. An ion chamber that has lost its fill gas through a leak reads low and drifts. A self-powered detector with failing insulation shows an erratic signal or a slow drift because leakage currents add to the tiny emitter current. Each of these produces a pattern that differs from a real change in flux, and comparison with redundant channels usually reveals it quickly.
A particular hazard is a failed instrument that reads plausibly. A stuck reading that does not change during a power manoeuvre may look normal at a glance. For this reason, operators verify that instruments respond as expected during planned changes, and periodic tests inject signals through the whole channel rather than only checking the display. The physics group's role is to know what each instrument should read at each condition, so that unexpected agreement as well as unexpected disagreement is noticed.
Gamma thermometers and other in-core sensors
Some designs supplement neutron detectors with gamma thermometers, small heated or unheated metal bodies whose temperature rise is proportional to local gamma heating, which in turn tracks local power. They have a long life because they rely on no nuclear reaction that burns out, and they can be calibrated in place by passing a known electrical current through a heater. Combined with core-exit thermocouples and in-core neutron detectors, they give several independent measurements of the same power distribution, which is valuable when one type of sensor is suspect.
Hana's summary
Hana's notes link this lesson to the detectors she studied earlier. Source-range counters are the pulse counters of lessons 2 and 6, intermediate and power ranges are the ion chambers of lesson 2 adapted to neutrons, and in-core detectors are the self-powered detectors of lesson 6 used in large numbers. What reactor instrumentation adds is overlap, redundancy, regular calibration against thermal power, and a constant comparison with the physics model, so that the operators can trust the numbers that matter most.
Summary and key terms
- Reactor flux spans more than ten decades; source, intermediate and power ranges overlap by at least a decade.
- Start-up rate in decades per minute is 26.06 divided by period in seconds.
- Ex-core detectors see leakage neutrons and are calibrated against a heat balance; split detectors measure axial offset.
- In-core SPNDs map the flux; delayed emitters for mapping, prompt emitters for protection.
- Measured in-core signals are compared with core-follow predictions to reconstruct the power distribution.
- Redundancy, voting logic, separation and routine testing make protection channels reliable.
- Source range
- The lowest power range, measured by counting individual neutrons.
- Start-up rate
- The rate of power increase in decades per minute.
- Ex-core detector
- A neutron detector outside the core that measures leakage flux.
- Axial offset
- The normalized difference between top and bottom core power in a PWR.
- Flux mapping
- Reconstructing the three-dimensional flux from in-core detector readings and a model.
- Heat balance
- Thermal power calculated from coolant or feedwater flow and temperatures.
- Voting logic
- Trip logic that acts when a set number of redundant channels agree.
Practice problems
Work each problem on paper first, then reveal the answer to check.
A period of 90 s. What is the start-up rate?
Show answer
26.06/90 ≈ 0.29 decades per minute.
At 0.5 DPM, how long does it take to rise four decades?
Show answer
8 minutes.
Why must source-range detectors overlap with the intermediate range?
Show answer
So that a valid indication and protection are available at all power levels during transitions.
Why can ex-core power readings change without a change in total power?
Show answer
They see leakage from edge assemblies, which depends on the power shape.
Why are prompt-response SPNDs used for overpower protection?
Show answer
They follow flux changes quickly enough for a trip.
A single in-core detector reads 8 % high compared with prediction at every map. Likely cause?
Show answer
A detector, sensitivity or cabling problem rather than a core problem.
Lesson quiz · 5 questions
Score 60% or more to complete this lesson.
Create a free account to save your progress, take quizzes and earn a certificate.