
MSAZ-281 · Lesson 10 of 12 · 20 min
Query plans and tuning
▶ Video coming soon A video version of this lesson is on the way.
Keiko Tanabe's nightly sales report has a query that takes eleven minutes on the old StockLine server and nineteen on the test Managed Instance. Everyone expected Azure to be faster, so the result causes some alarm in the migration stand-up. Elena brings the query to the clinic instead of to a bigger service tier. "Before we buy more vCores," she says, "we read the plan." This session is about reading execution plans and changing queries and settings so the optimizer can do its job.
Estimated and actual plans
An execution plan is the optimizer's recipe for a query: which indexes to read, in what order to join tables, which algorithms to use for joins and aggregations, whether to sort, and how many threads to use. An estimated plan shows what the optimizer intends, based on statistics, without running the query. An actual plan is captured when the query runs and adds what really happened: actual row counts for each operator, the number of executions, warnings such as spills to tempdb, and runtime statistics. Live query statistics show the plan filling in while a long query runs. Query Store keeps estimated plans for each query over time, and since SQL Server 2019 the last actual plan can also be kept in the plan cache with lightweight profiling.
Plans are read from right to left and top to bottom: data flows from the operators on the right, which read tables and indexes, toward the SELECT on the left. Each arrow's thickness shows how many rows flow along it. The first thing Walt looks for is a big difference between estimated and actual row counts, because that is where the optimizer was surprised, and a surprised optimizer chooses badly.
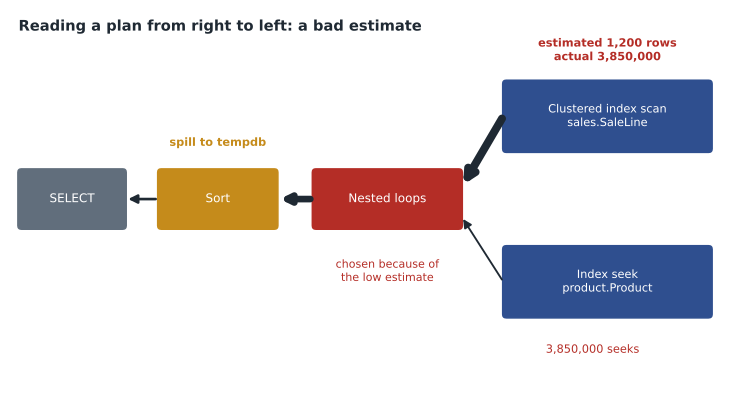
What the report query was doing
The plan of Keiko's query shows the pattern in the figure. The query filters sale lines with WHERE CONVERT(date, SaleTime) = @ReportDate. Wrapping the column in a function means the optimizer cannot use the histogram on SaleTime or seek on the index; it scans the whole table and guesses that a fixed small fraction of rows match. It estimates 1,200 rows; 3,850,000 arrive. Because it expected few rows, it chose a nested loops join, which looks up each row in the product table one at a time, and a memory grant sized for 1,200 rows, so the final sort spilled to tempdb. On the old server, a warm buffer pool hid much of the cost; on the new instance, with colder caches during the replay, it did not.
The fix is to make the predicate sargable, meaning searchable by an index: compare the column itself with a range. With WHERE SaleTime >= @ReportDate AND SaleTime < DATEADD(day, 1, @ReportDate), the optimizer can seek on the index on SaleTime and use the histogram. The estimate becomes 3.9 million, the join becomes a hash join, the memory grant fits, and the query finishes in 2 minutes 40 seconds on the test instance.
-- Before: the function on the column hides it from the index and the histogram
SELECT p.Department, SUM(sl.Quantity * sl.UnitPrice) AS sales
FROM sales.SaleLine AS sl
JOIN product.Product AS p ON p.Sku = sl.Sku
WHERE CONVERT(date, sl.SaleTime) = @ReportDate
GROUP BY p.Department;

-- After: a range on the bare column
SELECT p.Department, SUM(sl.Quantity * sl.UnitPrice) AS sales
FROM sales.SaleLine AS sl
JOIN product.Product AS p ON p.Sku = sl.Sku
WHERE sl.SaleTime >= @ReportDate AND sl.SaleTime < DATEADD(day, 1, @ReportDate)
GROUP BY p.Department;
Query constructs that hurt
DP-300 asks candidates to recommend changes to query constructs based on resource use. A handful of patterns cause most problems. Functions applied to columns in WHERE or JOIN clauses, as above. Implicit conversions, where a column of one type is compared with a parameter of another: a varchar column compared with an nvarchar parameter forces a conversion of every row and shows as a warning on the plan. Patterns in LIKE that start with a wildcard, such as a search for every product name ending in paint, which cannot seek. SELECT * in queries that need three columns, which defeats covering indexes. Scalar user-defined functions called for every row, which older versions could not inline. Row-by-row loops and cursors where one set-based statement would do. And OR conditions across different columns, which can sometimes be rewritten as a UNION of two seeks.
| Construct | Why it hurts | Better construct |
|---|---|---|
| Function on a column in WHERE | Prevents seeks and good estimates | Range or computed column with an index |
| Implicit conversion | Converts every row; may prevent seeks | Match parameter types to column types |
| Leading wildcard in LIKE | Forces a scan | Full-text search, or store a reversed or split value |
| SELECT * | Reads unneeded columns; defeats covering indexes | Name the needed columns |
| Cursor or loop over rows | Many small statements, much overhead | One set-based statement |
| Scalar function per row | Runs once per row, may block parallelism | Inline table-valued function or inlining on current versions |
Parameter sensitivity
Stored procedures and parameterized queries are compiled once and the plan is reused. The plan is optimized for the parameter values of the first call, which is called parameter sniffing. Usually that is good. It goes wrong when data is skewed: a procedure that lists redemptions for a store compiles first for store 47, a tiny store, and builds a plan with a nested loops join that is ideal for 30 rows; the next call, for store 12 with 5,400 rows, reuses that plan and runs slowly. Hana sees exactly this in the Finch Rewards test database.
There are several remedies. OPTION (RECOMPILE) compiles a fresh plan for each execution, which costs CPU but is fine for queries that run rarely. OPTIMIZE FOR a typical value, or OPTIMIZE FOR UNKNOWN, picks one plan deliberately. Splitting the procedure, so big and small stores take different paths, is clearer. And on SQL Server 2022, Managed Instance and Azure SQL Database at compatibility level 160 or higher, parameter sensitive plan optimization can keep several plans for one query, chosen by the parameter value's size range, automatically.
Intelligent query processing
Recent versions of the engine include a family of features, called intelligent query processing, that improve plans without code changes. They switch on through the database compatibility level, which is one reason to run at the current level after a migration. Adaptive joins decide between a nested loops and a hash join at run time, after seeing how many rows arrived. Memory grant feedback corrects grants that were too small, causing spills, or too large, wasting memory, on later executions. Degree of parallelism feedback lowers the number of threads for queries that do not benefit from more. Cardinality estimation feedback adjusts modelling assumptions for queries whose estimates were repeatedly wrong. Approximate count distinct gives fast, slightly inexact counts for huge tables. Scalar function inlining turns many scalar functions into inline expressions.
| IQP feature | Problem it addresses | Use case at Harrow & Finch |
|---|---|---|
| Adaptive joins | Wrong join type because of a bad estimate | Report queries with varying date ranges |
| Memory grant feedback | Spills or wasted memory grants | Sorts in the nightly report |
| Parameter sensitive plan optimization | One cached plan for very different parameter values | Redemptions by store, large and small |
| Degree of parallelism feedback | Too many threads for a query's benefit | Busy reporting hours on the instance |
| Cardinality estimation feedback | Repeated misestimates from model assumptions | Correlated filters on store and department |
| Approximate count distinct | Slow exact distinct counts on huge tables | Number of distinct members per month |
The StockLine test copy came from SQL Server 2016 at compatibility level 130. Walt raises it to 160 on the test instance only after capturing a week of Query Store data at 130, so that if a query gets worse at the new level he can see its old plan and force it, which is the next lesson's subject. This is Microsoft's recommended upgrade path: keep the old compatibility level at first, collect a baseline, raise the level, and compare.
Hints, Query Store hints and plan forcing
Sometimes the right fix cannot be made in the code, because the query comes from a vendor's application. Query hints such as OPTION (RECOMPILE), MAXDOP or USE HINT change behaviour for one statement but must be written into the query text. Query Store hints apply a hint to a query by its Query Store identifier, without touching the code, with sys.sp_query_store_set_hints. Plan forcing pins a query to a specific plan from Query Store with sp_query_store_force_plan. Both are powerful and both need tracking, because a forced plan or hint that made sense last year may be wrong after data grows. Walt keeps a list of every forced plan and hint with the reason and a review date.
-- Warehouse vendor query 4417 runs better without parallelism; apply a hint without changing its code
EXEC sys.sp_query_store_set_hints @query_id = 4417, @query_hints = N'OPTION (MAXDOP 1)';

-- Review every Query Store hint in the database
SELECT query_id, query_hint_text, last_query_hint_failure_reason_desc
FROM sys.query_store_query_hints;
Blocking, tempdb and other server settings
Not every slow query is the plan's fault. A query may be waiting for locks, as in lesson 8, or for tempdb, or for memory. On Managed Instance and SQL Server on VMs, server-level settings also matter: max degree of parallelism and cost threshold for parallelism control when and how widely queries go parallel, and on VMs, tempdb files on the local temporary disk and max server memory set below the VM's memory are the usual first steps. Database-scoped configurations, available on all three, set MAXDOP and several optimizer behaviours per database, which is how Azure SQL Database exposes most of these choices. DP-300 lists both kinds of setting.
ALTER DATABASE SCOPED CONFIGURATION SET MAXDOP = 4;
ALTER DATABASE SCOPED CONFIGURATION SET PARAMETER_SENSITIVE_PLAN_OPTIMIZATION = ON;
SELECT name, value FROM sys.database_scoped_configurations
WHERE name IN ('MAXDOP', 'PARAMETER_SENSITIVE_PLAN_OPTIMIZATION');
Worked problem
How much faster is the rewritten report, and was more compute needed?
The report query took 19 minutes on the test instance with 8 vCores. After the sargable rewrite it took 2 minutes 40 seconds. Before the rewrite, someone had proposed moving to 16 vCores, which would at best halve the time of a query limited by CPU, at roughly double the compute cost. Compare the speed-up from the rewrite with the best case from doubling vCores.
Show solution
- Convert to seconds: 19 minutes = 1,140 s; 2 minutes 40 seconds = 160 s.
- \[1{,}140 \div 160 \approx 7.1\]
- The rewrite made the query about 7 times faster, at no extra cost.
- Doubling vCores would at best make a CPU-bound query twice as fast: 1,140 ÷ 2 = 570 s, about 9.5 minutes, and this query was not even CPU-bound; it was hurt by a bad estimate, a poor join choice and a spill.
- Doubling compute would also double the compute part of the bill every month.
Answer: The rewrite gave a seven-fold speed-up, from 19 minutes to under 3, while doubling vCores would at best have reached about 9.5 minutes at twice the compute cost. Elena writes this on the whiteboard as the clinic's rule: read the plan before buying hardware.
Common mistakes
MistakeA slower query after migration means the new service tier is too small.
InsteadRead the plan first; bad estimates, non-sargable predicates and spills are common causes.
MistakeEstimated plans show how many rows were actually processed.
InsteadOnly actual plans or live statistics show actual row counts.
MistakeOPTION (RECOMPILE) is free.
InsteadIt compiles on every execution, costing CPU; use it for rare or highly variable queries.
MistakeRaising the compatibility level never makes queries slower.
InsteadSome queries regress; capture a Query Store baseline first so old plans can be forced if needed.
Summary and key terms
- Execution plans show how a query runs; actual plans add real row counts and warnings such as spills.
- Large gaps between estimated and actual rows reveal where the optimizer was misled.
- Sargable predicates compare bare columns with values or ranges; functions on columns and implicit conversions prevent seeks.
- Parameter sniffing can reuse a plan unsuited to other values; recompile, OPTIMIZE FOR, splitting or parameter sensitive plan optimization can help.
- Intelligent query processing features, enabled through the compatibility level, fix many plan problems automatically.
- Query Store hints and plan forcing change behaviour without code changes but need a register and reviews.
- Execution plan
- The sequence of operators the engine uses to run a query.
- Actual plan
- An execution plan captured during execution, with real row counts and runtime warnings.
- Sargable
- Describes a predicate that can use an index seek and statistics, typically a bare column compared with a value.
- Implicit conversion
- An automatic data type conversion the engine adds when compared types differ.
- Parameter sniffing
- Compiling a plan for the parameter values of the first execution and reusing it.
- Intelligent query processing
- A family of engine features that adapt plans automatically, such as adaptive joins and memory grant feedback.
- Query Store hint
- A query hint applied to a query through Query Store without changing its text.
Practice problems
Work each problem on paper first, then reveal the answer to check.
In which direction is an execution plan read?
Show answer
From right to left, following the data toward the SELECT operator.
Why is CONVERT(date, SaleTime) = @d a problem in a WHERE clause?
Show answer
The function on the column prevents an index seek and good use of statistics.
What does memory grant feedback correct?
Show answer
Grants that were too small, causing spills, or too large, wasting memory, on later executions.
How can a DBA change a vendor query's behaviour without editing its code?
Show answer
With a Query Store hint or by forcing a plan.
Why keep the old compatibility level for a week after migration?
Show answer
To capture a baseline in Query Store so regressions after raising it can be found and old plans forced.
Lesson quiz · 5 questions
Score 60% or more to complete this lesson.
Create a free account to save your progress, take quizzes and earn a certificate.