
MSAZ-190 · Lesson 9 of 12 · 22 min
Reviewing the DP-900 outline
▶ Video coming soon A video version of this lesson is on the way.
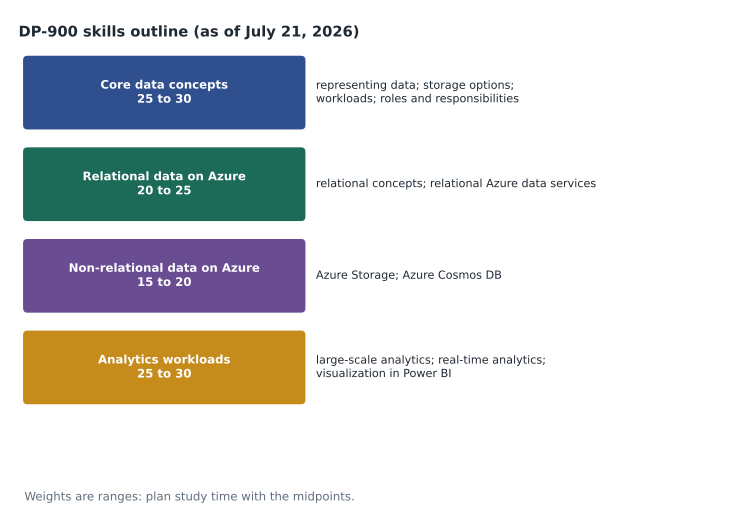
Keiko's nightly sales report has run the same way for six years: a SQL Server job at two in the morning, a set of views, and an Excel workbook emailed to forty store managers at seven. Project Skylight will replace it with an analytics platform on Azure and Power BI reports, and Keiko will help design it. DP-900 is her way of learning the vocabulary before the design meetings start. "I know relational data," she tells Renata. "Everything else on this outline is new." This lesson reviews the DP-900 outline dated July 21, 2026, with key ideas, common distinctions and original practice items, assuming you have studied MSAZ-120 and MSAZ-121.
Area 1: Describe core data concepts (25 to 30)
The first area is about data itself. Ways to represent data include structured data, which fits a fixed schema of rows and columns; semi-structured data, such as JSON documents, which carries its own structure that can vary between records; and unstructured data, such as images, audio and free text. Storage options include files in common formats, such as delimited text like CSV, JSON, XML, and the column-oriented formats Parquet and ORC, as well as the row-oriented Avro, and databases, both relational and non-relational. Keiko's existing report is structured data in a relational database; the store managers' comments box is unstructured text; the loyalty app's event feed is semi-structured JSON.
Common data workloads are transactional and analytical. Transactional processing, often called OLTP, handles many small, fast reads and writes, such as recording each sale at a till, and emphasizes consistency so that each transaction completes fully or not at all. Analytical processing, often called OLAP, handles large queries over historical data, such as comparing this year's December sales with last year's by region, and emphasizes read performance over large volumes. The roles objective asks you to tell apart a database administrator, who manages databases, security and backups; a data engineer, who builds the pipelines that move and transform data; and a data analyst, who explores data and builds reports and visualizations. At Harrow & Finch, Keiko is the analyst; the StockLine database administrator and a new data engineer will build the platform with her.
| Pair | The difference the exam tests |
|---|---|
| Structured and semi-structured | A fixed schema for every row versus a structure carried in each record |
| OLTP and OLAP | Many small transactions versus large analytical queries over history |
| Row-oriented and column-oriented files | Avro stores rows together; Parquet and ORC store columns together, which suits analytics |
| Data engineer and data analyst | Builds pipelines and stores versus explores data and builds reports |
| Batch and stream processing | Processes data in collected groups versus processes each event as it arrives |
Area 2: Identify considerations for relational data on Azure (20 to 25)
Relational concepts include tables of rows and columns, primary keys that identify each row, foreign keys that link tables, normalization, which splits data into related tables to avoid repetition, and the SQL language. Know the difference between data definition statements such as CREATE and ALTER, which change structure, and data manipulation statements such as SELECT, INSERT, UPDATE and DELETE, which work with the data. Know what views, stored procedures and indexes are for. The code below builds a tiny normalized sales database in memory and runs an analytical query, the kind Keiko writes every week.
import sqlite3
db = sqlite3.connect(":memory:")
db.executescript("""
CREATE TABLE store (store_id INTEGER PRIMARY KEY, city TEXT);
CREATE TABLE sale (sale_id INTEGER PRIMARY KEY,
                   store_id INTEGER REFERENCES store(store_id),
                   amount REAL);
INSERT INTO store VALUES (1, 'Store A'), (2, 'Store B');
INSERT INTO sale (store_id, amount) VALUES (1, 120.0), (1, 80.5), (2, 42.0), (2, 310.0), (2, 15.5);
""")
query = """SELECT s.city, COUNT(*) AS sales, ROUND(SUM(x.amount), 2) AS total
           FROM sale x JOIN store s ON s.store_id = x.store_id
           GROUP BY s.city ORDER BY total DESC"""
for row in db.execute(query):
print(row)('Store B', 3, 367.5)
('Store A', 2, 200.5)What this code does
Builds small store and sale tables in an in-memory database and runs a query that joins them and totals the number and amount of sales per store, largest first. The output lists each store with its count and total. This reviews the relational and SQL concepts tested on DP-900.
The relational Azure data services objective covers the Azure SQL family and the open-source databases. Azure SQL Database is a fully managed database for new cloud applications. Azure SQL Managed Instance offers near-complete compatibility with SQL Server for migrating existing databases with minimal changes. SQL Server on Azure Virtual Machines gives full control of the operating system and SQL Server, at the cost of managing them yourself. Azure also offers managed services for PostgreSQL and MySQL. For StockLine, which depends on SQL Server features and agent jobs, the team is evaluating Managed Instance; a brand-new reporting database might suit SQL Database.
Area 3: Describe considerations for working with non-relational data on Azure (15 to 20)
The Azure Storage objective covers Blob Storage for objects such as images, documents and data files; Azure Data Lake Storage Gen2, which adds a hierarchical namespace to Blob Storage for analytics; Azure Files for file shares; and Table Storage for simple key-value data. The Azure Cosmos DB objective covers a globally distributed, multi-model database with several APIs, including the NoSQL API for JSON documents and APIs compatible with MongoDB, Apache Cassandra, Apache Gremlin for graphs and Table. Know when Cosmos DB suits a workload: very low-latency reads and writes, flexible schemas, global distribution or massive scale. The rebuilt loyalty app, Finch Rewards, is a candidate for Cosmos DB because its member profiles vary in shape and it needs fast responses on phones across the country.
Area 4: Describe an analytics workload (25 to 30)
The large-scale analytics objective covers the path data takes from sources to insight: ingestion, often by pipelines; storage in a data lake, a data warehouse or a lakehouse, which combines the flexible storage of a lake with warehouse-style tables and queries; processing; and serving to reports. Know the main services at a descriptive level, including Microsoft Fabric, which brings data engineering, warehousing, real-time analytics and Power BI into one software-as-a-service platform, and Azure Databricks, a platform for Apache Spark. The real-time analytics objective covers processing streams of events as they arrive, for example till transactions or sensor readings, with services such as Azure Event Hubs for ingestion and Azure Stream Analytics or Fabric's real-time capabilities for processing. The Power BI objective covers semantic models, reports and dashboards, and common visual types.
The design that Keiko's team is sketching follows the standard pattern: nightly batch extracts from StockLine and the warehouse system into a lakehouse, a near-real-time feed of till events for same-day sales, and Power BI reports for store managers. On the exam, you will not need to know how to build it, but you should recognize each part and know why it is there.
Power BI in a little more depth
Because the Power BI objective is the most concrete part of the analytics area, it is worth a closer look. Power BI Desktop is the application in which analysts connect to data, shape it and build reports; the Power BI service is the online platform where reports are published, shared and refreshed. A semantic model holds the tables, the relationships between them and calculations called measures, such as total sales or sales growth compared with last year. Reports are built from one or more pages of visuals over a semantic model, and they are interactive: clicking a bar in one visual filters the others. A dashboard is a single page of tiles pinned from one or more reports, designed for a quick look at the most important figures.
Know the purpose of common visual types. Bar and column charts compare categories, such as sales by store. Line charts show trends over time. A matrix is a table with grouped rows and columns, like a pivot table. A card shows a single number, such as today's total sales, and a key performance indicator visual compares a value with a target. Maps place values by location. Keiko's first Power BI design for the store managers has a card for yesterday's sales, a line chart of the last thirteen weeks, a bar chart comparing stores in the same district and a matrix of departments by week. Asking which visual answers which business question is exactly the kind of item DP-900 uses.
A decision path for choosing a data store
Many DP-900 items describe a workload and ask where its data should live. A short sequence of questions helps. First, what is the shape of the data: fixed rows and columns, varying documents, simple key-value pairs, files or large binary objects? Second, what is the workload: many small transactions, large analytical queries or a continuous stream of events? Third, are there special requirements, such as existing SQL Server features that must keep working, global distribution with very low latency, or a hierarchical file system for analytics? The answers usually point to one service. Fixed rows with transactions and SQL Server features point to Managed Instance. Varying documents with global low latency point to Cosmos DB. Large files for analytics point to Data Lake Storage Gen2. Shared folders that applications open with SMB point to Azure Files.
The same sequence works in reverse when an item names a service and asks what it is for. If you can say in a sentence what shape of data and what workload each service is designed for, most DP-900 storage questions become straightforward. Keiko writes that sentence for each of the nine services in her outline and tests herself on it every Friday.
Original practice items
(1) A retailer records each sale at the till and must never lose half a transaction. Which workload? Transactional processing, OLTP. (2) Which file format stores data by column and suits analytical queries: Avro, CSV or Parquet? Parquet. (3) A company is moving an existing SQL Server database with agent jobs to Azure and wants minimal changes and no operating system to manage. Which service? Azure SQL Managed Instance. (4) True or false: a foreign key uniquely identifies each row in its own table. False; that is a primary key, and a foreign key refers to a primary key in another table. (5) Which role builds the pipelines that load data into a lakehouse? A data engineer.
(6) A mobile app stores user profiles whose fields vary between users and needs fast reads worldwide. Which service fits? Azure Cosmos DB. (7) Store managers want a single page showing the most important figures from several reports. Which Power BI item? A dashboard. (8) Sensor readings arrive every second and must trigger an alert within moments when a freezer warms. Batch or stream processing? Stream processing.
Worked problem
Placing Harrow & Finch data on the outline
Keiko lists five kinds of company data: till transactions, product photos, loyalty member profiles, store managers' free-text comments and the nightly sales summary. For each, identify the type of data and a likely Azure home.
Show solution
- Till transactions: structured, transactional; a relational database such as Azure SQL Managed Instance for StockLine.
- Product photos: unstructured; Blob Storage.
- Loyalty member profiles: semi-structured JSON with varying fields; Azure Cosmos DB.
- Managers' comments: unstructured text; stored in a lake and analyzed later, possibly with language AI.
- Nightly sales summary: structured, analytical; tables in a lakehouse or warehouse, served by Power BI.
Answer: Matching data type to workload and service is the core skill DP-900 tests.
Keiko's diagnostic gap in non-relational data closes over three weeks of study. Her mistakes log's most frequent entry is the difference between Data Lake Storage Gen2 and plain Blob Storage, which she finally fixes by remembering one word: hierarchical.
Common mistakes
MistakeCalling JSON documents unstructured.
InsteadJSON is semi-structured: it carries its own structure.
MistakeChoosing SQL Database for an existing SQL Server workload that needs instance features.
InsteadManaged Instance is designed for near-complete compatibility.
MistakeConfusing a primary key with a foreign key.
InsteadA primary key identifies a row; a foreign key refers to another table's primary key.
MistakeTreating a dashboard and a report as the same thing.
InsteadA report has pages of visuals; a dashboard is a single page of pinned tiles.
MistakeChoosing batch processing for alerts that must fire immediately.
InsteadUse stream processing for events that need an immediate response.
Summary and key terms
- DP-900, dated July 21, 2026, has four areas: core data concepts 25 to 30, relational data 20 to 25, non-relational data 15 to 20, analytics 25 to 30.
- Know structured, semi-structured and unstructured data and common file formats.
- OLTP handles many small transactions; OLAP handles large analytical queries.
- Know the roles of database administrator, data engineer and data analyst.
- Azure SQL Database, Managed Instance and SQL Server on VMs differ in compatibility and control.
- Azure Storage and Cosmos DB serve non-relational data; analytics uses lakes, warehouses, lakehouses, streams and Power BI.
- Semi-structured data
- Data such as JSON that carries its own, possibly varying, structure.
- OLTP
- Online transaction processing: many small, consistent reads and writes.
- OLAP
- Online analytical processing: large queries over historical data.
- Normalization
- Splitting data into related tables to reduce repetition.
- Lakehouse
- A store combining a data lake's flexibility with warehouse-style tables.
- Semantic model
- In Power BI, the model of tables, relationships and measures that reports use.
Practice problems
Work each problem on paper first, then reveal the answer to check.
How are DP-900's four areas weighted?
Show answer
25 to 30, 20 to 25, 15 to 20 and 25 to 30.
Is CSV row-oriented or column-oriented?
Show answer
Row-oriented; it is delimited text with one record per line.
Which SQL statement type changes a table's structure?
Show answer
Data definition, such as CREATE or ALTER.
What does Data Lake Storage Gen2 add to Blob Storage?
Show answer
A hierarchical namespace for analytics.
Name two APIs offered by Azure Cosmos DB.
Show answer
The NoSQL API and the MongoDB-compatible API, among others.
What is Microsoft Fabric?
Show answer
A software-as-a-service analytics platform bringing together engineering, warehousing, real-time analytics and Power BI.
Which role builds reports and explores data?
Show answer
A data analyst.
Lesson quiz · 5 questions
Score 60% or more to complete this lesson.
Create a free account to save your progress, take quizzes and earn a certificate.