
MSAZ-102 · Lesson 12 of 12 · 18 min
Azure Monitor, Log Analytics and Application Insights
▶ Video coming soon A video version of this lesson is on the way.
Advisor tells you what to improve and Service Health tells you what Microsoft is doing to the platform. Neither tells you whether StockLine is slow for the store managers this morning, whether the head office VPN dropped for ten minutes last night or why the test copy of harrowfinch.com takes four seconds to show a product page. Those questions are about your systems, and answering them needs data collected from those systems. In Azure, that is the job of Azure Monitor. Theo spent the second week of November setting it up for the Skylight pilot, and the first thing it found was a problem nobody had noticed.
What Azure Monitor is
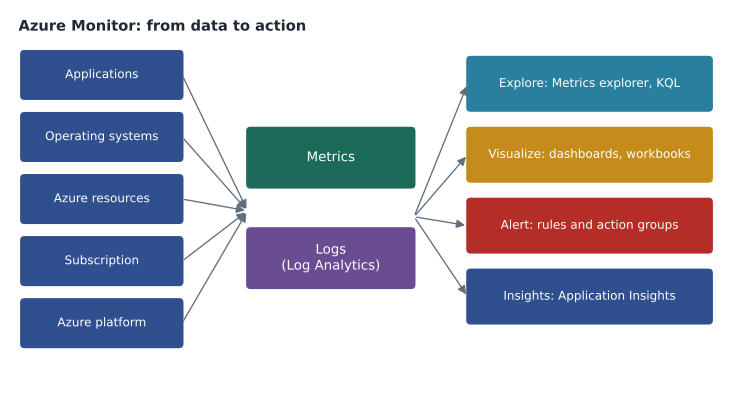
Azure Monitor is Azure's platform for collecting, analyzing and acting on telemetry from cloud and on-premises environments. It gathers data from Azure resources, from the operating systems inside virtual machines and Arc-enabled servers, from applications, and from the Azure platform itself. It stores that data, lets you explore it with charts and queries, and raises alerts when something needs attention. Many of the tools in earlier lessons, such as Service Health alerts and the action groups that send notifications, are part of Azure Monitor.
Some monitoring happens automatically. Every Azure resource produces platform metrics, such as a VM's CPU usage or a storage account's transactions, and the subscription keeps an activity log of management operations, such as who created or deleted a resource. Other data must be switched on: resource logs, which record detailed operations inside a service, are routed with diagnostic settings, and data from inside an operating system is collected by the Azure Monitor Agent using data collection rules that say what to collect and where to send it.
Metrics and logs
Azure Monitor stores two main kinds of data. Metrics are numbers measured at regular intervals, such as CPU usage every minute. They are lightweight, arrive in near real time and are ideal for charts and fast alerts. Metrics explorer in the portal charts them, and charts can be pinned to dashboards. Logs are records of events with many fields, such as each request to a web server, each error from an application or each sign-in. Logs are richer and can be searched and combined in powerful ways, but they take longer to arrive and cost more to store.
| Metrics | Logs | |
|---|---|---|
| Form | Numeric values over time | Records with many fields, text and numbers |
| Typical examples | CPU usage, requests per second, disk queue length | Event logs, request records, security events, application traces |
| Speed | Near real time | Usually within minutes |
| Explored with | Metrics explorer | Log Analytics with Kusto Query Language |
| Best for | Fast alerts and trend charts | Investigation, correlation and detailed reports |
Log Analytics
Logs are stored in a Log Analytics workspace, a data store in a region with its own access controls, retention settings and pricing. Harrow & Finch created one central workspace, law-hf-cc, in its primary region, and pointed the VMs, the Arc-enabled servers, the VPN gateway's diagnostic settings and the Azure Firewall logs to it. One workspace makes it easier to search across everything at once, though large organizations sometimes use several for separation or data residency.
Log Analytics is the tool in the portal for querying that data. Queries are written in Kusto Query Language (KQL), a read-only language designed for exploring large volumes of log and time-series data. A KQL query starts with a table and passes it through a pipeline of operations, each separated by a vertical bar: filter rows, choose columns, summarize, sort and chart. Queries can be saved, shared, used in workbooks and dashboards, and used as the condition for alerts.
Heartbeat
| where TimeGenerated > ago(1h)
| summarize LastSeen = max(TimeGenerated) by Computer
| where LastSeen < ago(10m)
| order by LastSeen ascAzureDiagnostics
| where Category == "TunnelDiagnosticLog"
| where TimeGenerated > ago(1d)
| project TimeGenerated, status_s, remoteIP_s
| order by TimeGenerated descLogs cost money to collect and keep. Workspaces charge for the data ingested and for retention beyond the included period, and different table plans offer cheaper options for logs that are rarely queried. Collecting every possible log from every resource can easily cost more than the resources themselves. Theo's data collection rules started small: key Windows and Linux event logs, performance counters at a one-minute interval, the firewall and VPN logs, and nothing else until someone had a real use for it. He added the monitoring costs to the estimate from lesson 2 with illustrative rates.
Alerts
An alert rule watches a signal and fires when a condition is met. The signal can be a metric, such as CPU above a threshold for five minutes; a log search, such as the heartbeat query above returning any rows; the activity log, such as someone deleting a resource group; or Service Health and Resource Health events, as the previous lesson described. Each rule has a severity from 0, the most critical, to 4, and one or more action groups that send notifications or run automation. Alert processing rules can suppress notifications during planned maintenance windows or add actions to many alerts at once.
| Alert at Harrow & Finch | Signal | Condition | Action |
|---|---|---|---|
| VPN tunnel down | Resource Health and VPN metrics | Tunnel disconnected for more than 2 minutes | Email, mobile app and text to the on-call administrator |
| StockLine VM CPU high | Metric | Average CPU above 85 out of 100 for 15 minutes | Email to the platform team |
| Machine stopped reporting | Log search | Heartbeat query returns rows | Email and ticket |
| Resource group deleted | Activity log | Delete operation on any resource group | Email to Renata and Sunil |
| Service issue in our regions | Service Health | New service issue | Email and mobile app |
Theo wrote a small script to understand how a metric alert evaluates a window of data. The condition fires only when the average over the window exceeds the threshold, which avoids alerts for a single brief spike.
cpu = [42, 47, 95, 51, 49, 88, 91, 93, 90, 89, 92, 87]   # one reading per 5 minutes
threshold, window = 85, 3                                # average over 15 minutes

for i in range(window, len(cpu) + 1):
    avg = sum(cpu[i - window:i]) / window
    state = "FIRED" if avg > threshold else "ok"
print(f"Readings {i - window + 1:2d}-{i:2d}: average {avg:5.1f} -> {state}")Readings 1- 3: average 61.3 -> ok Readings 2- 4: average 64.3 -> ok Readings 3- 5: average 65.0 -> ok Readings 4- 6: average 62.7 -> ok Readings 5- 7: average 76.0 -> ok Readings 6- 8: average 90.7 -> FIRED Readings 7- 9: average 91.3 -> FIRED Readings 8-10: average 90.7 -> FIRED Readings 9-11: average 90.3 -> FIRED Readings 10-12: average 89.3 -> FIRED
What this code does
Simulates a metric alert on processor use: it takes a reading every five minutes and averages the last three readings, a 15-minute window. Whenever the average is above the threshold of 85 it reports the alert as fired, otherwise ok. The output shows that a single spike does not trigger the alert, but a sustained high load does.
Application Insights
Infrastructure metrics show whether servers are healthy, but users experience applications. Application Insights is the feature of Azure Monitor for application performance monitoring. It collects telemetry from inside applications, such as requests and their response times, calls to dependencies like databases and web services, exceptions, page views and custom events. It works with applications hosted in Azure, on premises or in other clouds, and current versions are based on the open standard OpenTelemetry, so many languages and frameworks are supported.
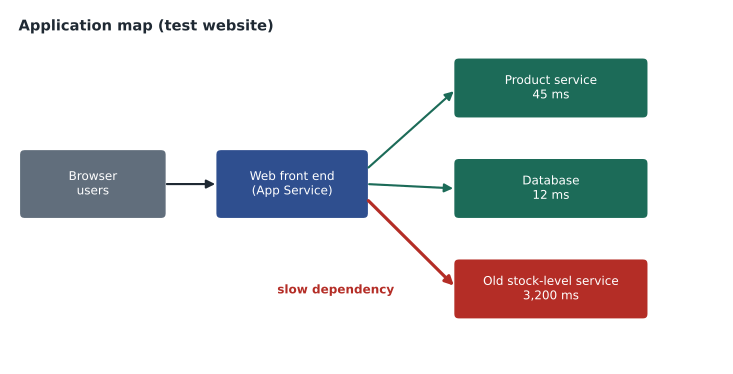
Application Insights turns that telemetry into views that help developers and operators. The application map shows the components of an application and the calls between them, with failure rates and response times on each link. Live metrics show requests and failures as they happen. Availability tests check a web address from several locations around the world at regular intervals and alert if it fails or is slow. Smart detection looks for unusual patterns, such as a sudden rise in failed requests, and alerts automatically. The data itself is stored in a Log Analytics workspace, so it can be queried with KQL alongside the infrastructure logs.
The web team enabled Application Insights on the test copy of harrowfinch.com running in App Service. Within a day, the application map showed the problem behind the four-second product pages: every page called the outside web firm's old stock-level service in a data centre in another country, and each call took more than three seconds. Nobody had noticed because the old site cached the result in a way the copy did not. Marcus Feldt's team changed the copy to read stock levels from StockLine's new interface in Azure, and the product pages dropped to well under a second.
Visualizing and sharing
Azure Monitor data can be shown in several ways. Azure dashboards in the portal pin charts and query results together, as lesson 8 described. Workbooks combine text, queries, metrics and parameters into interactive reports, and many services ship ready-made workbooks, called insights, such as VM insights and network insights. Azure Monitor data can also be shown in Grafana dashboards and exported to other tools. Renata built a Skylight operations workbook showing VPN health, VM health, the top alerts of the week and the monitoring cost, and it became the first thing on the screen at the weekly platform meeting.
Putting the course together
Over the last twelve lessons, Harrow & Finch moved from a surprising invoice to a governed cloud. Costs are understood from their factors, estimated with the pricing calculator and an Azure Migrate business case, and tracked with Cost Management, budgets and tags. Data is inventoried and protected with Microsoft Purview. Azure Policy and initiatives enforce standards, resource locks prevent accidents, and the Service Trust Portal provides evidence for auditors. The portal, Cloud Shell, the CLI and PowerShell manage resources, Azure Arc brings on-premises servers into the same view, and Bicep will rebuild the landing zone as code. Advisor, Service Health and Azure Monitor watch over all of it.
These topics form the management and governance part of the AZ-900 exam, which the current skills outline weights at 30 to 35 parts in 100, with cloud concepts and Azure architecture and services making up the rest. The skills outline reports a passing score of 700 on a scale of 1 to 1,000. Theo has his exam planned for January 2027, after the holiday rush in the stores. His study plan pairs each lesson in MSAZ-101 and MSAZ-102 with the matching Microsoft Learn module and a free practice assessment, and the readiness course, MSAZ-190, covers how the exam works and a structured review.
Monitoring as a habit
Good monitoring is as much about people as tools. Each alert at Harrow & Finch has an owner and a short runbook page that says what the alert means, what to check first and who to call. Alerts that fire often without needing action are tuned or removed, because people stop reading alerts that are usually noise. Once a month, the platform team reviews which alerts fired, which were useful and which missed a real problem, and adjusts the rules. That review is what turns a collection of alert rules into a monitoring system the team trusts.
Worked problem
Choosing the monitoring tool
Four needs come up: (1) be told within minutes if the head office VPN tunnel drops; (2) find out which machines stopped sending data overnight; (3) see why the product page of the test website is slow; (4) see which Azure services are having problems worldwide.
Show solution
- (1) A metric or Resource Health alert rule in Azure Monitor with an action group.
- (2) A log query in Log Analytics against the Heartbeat table, or an alert based on it.
- (3) Application Insights, using the application map and dependency data.
- (4) The Azure status page, from the previous lesson.
Answer: Azure Monitor alerts, Log Analytics, Application Insights and Azure status, in that order.
Common mistakes
MistakeCollecting every log from every resource by default.
InsteadCollect what has a use, because log ingestion and retention cost money.
MistakeUsing metrics to investigate a complex failure.
InsteadMetrics show that something changed; logs in Log Analytics show why.
MistakeExpecting Azure Monitor to collect guest OS logs automatically.
InsteadInstall the Azure Monitor Agent and create data collection rules.
MistakeAlerting on single spikes.
InsteadEvaluate averages over a window so alerts mean something.
Summary and key terms
- Azure Monitor collects telemetry from applications, operating systems, Azure resources, subscriptions and the platform, for Azure and on-premises systems.
- Metrics are near-real-time numbers explored in Metrics explorer; logs are detailed records stored in Log Analytics workspaces and queried with Kusto Query Language.
- Alert rules watch metrics, log searches, the activity log and health events, and use action groups to notify people or run automation.
- Application Insights monitors application performance with requests, dependencies, exceptions, application maps, live metrics and availability tests.
- Dashboards and workbooks present the results.
- Azure Monitor
- Azure's platform for collecting, analyzing and acting on telemetry.
- Metric
- A numeric value measured at regular intervals.
- Log Analytics workspace
- A data store for log data, with its own access, retention and pricing.
- Kusto Query Language
- The read-only query language used in Log Analytics.
- Alert rule
- A rule that fires when a signal meets a condition and triggers action groups.
- Application Insights
- The Azure Monitor feature for application performance monitoring.
- Diagnostic setting
- A setting that routes a resource's logs and metrics to a destination such as a workspace.
Practice problems
Work each problem on paper first, then reveal the answer to check.
What language is used to query logs in Log Analytics?
Show answer
Kusto Query Language (KQL).
Which Azure Monitor feature shows the calls between an application's components?
Show answer
The Application Insights application map.
What sends the notifications when an alert fires?
Show answer
An action group.
Lesson quiz · 5 questions
Score 60% or more to complete this lesson.
Create a free account to save your progress, take quizzes and earn a certificate.