
MBA-699 · Lesson 9 of 12 · 20 min
Making recommendations: the business case and risks
In the ninth week the team turns its preferred option into a recommendation the board can approve. A recommendation is more than a choice among options. It states what the client should do, why, what it will cost and return, what could go wrong, and what decisions are needed now. Doug Pankratz, the co-op's chief financial officer, tells the team what he needs: Give me numbers I can defend to the audit committee and a plan I can track. If it only works when everything goes right, tell me now.
This lesson follows how the team built the business case for Member First, tested it under different scenarios, identified the inputs that matter most and set out the risks and how to manage them.
Building the business case
A business case compares the costs and benefits of a decision over time, usually as a net present value, the method the cohort studied with Dr. Varga in MBA-511. For an operating program like Member First, the main elements are the annual benefits once the program is running, how quickly they ramp up, the one-time costs of getting there, the ongoing costs of running new systems and services, and the discount rate.
The team builds each benefit from the analysis in lessons 5 and 6, choosing estimates the managers believe are achievable rather than the full benchmark gaps.
- Shrink: closing half the gap to peers, from 4.1 to 3.4 per cent of sales, worth 2.23 million dollars a year.
- Promotions: cutting promotions that do not lift sales and simplifying the rest, worth 1.00 million.
- Scheduling: matching wage hours to traffic, worth 0.95 million, mainly through turnover and less overtime.
- Store portfolio: closing Store 7 and converting Stores 15, 19 and 21 into a smaller format run with the co-op's fuel sites, worth 1.10 million after the fuel margin lost in Store 7's town.
- Digital members: online ordering with pickup at eight stores and a member app with regular rewards, worth 0.85 million after picking and reward costs.
Against these, the program has running costs of about 0.80 million a year for software subscriptions, app operations and extra support staff, and one-time costs of about 7.5 million: ordering and scheduling systems, the app and pickup areas, store conversions, the closure, training and a small program office for two years.
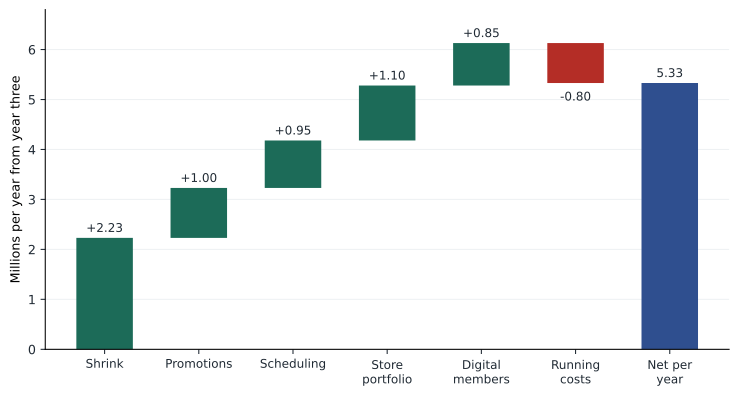
The waterfall shows that the core fixes, shrink, promotions and scheduling, provide about two-thirds of the gross benefit. Digital members, the part of the program that most excites Colin, is the smallest item and the least certain. Grace insists that the team say so plainly. The digital program is justified less by its direct profit than by its role in winning younger members, and the board should approve it as a tested bet, not as a profit engine.
Net present value and scenarios
The team uses a discount rate of 8 per cent, reflecting the co-op's cost of borrowing from its credit union and the return members could earn elsewhere on their equity, and a seven-year horizon, the expected life of the systems. Benefits ramp up at 35 per cent of the full amount in the first year, 75 per cent in the second and 100 per cent from the third.
# Business case for the recommended Member First program (millions of dollars, 7 years)
rate = 0.08
ramp = [0.35, 0.75, 1.0, 1.0, 1.0, 1.0, 1.0]
benefit = {"shrink": 2.23, "promotions": 1.00, "scheduling": 0.95, "store portfolio": 1.10, "digital members": 0.85}
running = 0.80                       # software subscriptions, app operations, extra support
one_time = [4.6, 2.9, 0.0, 0, 0, 0, 0]   # systems, app, conversions, closure, program office
def npv(b=benefit, run=running, once=one_time, r=rate, scale=1.0):
    total = 0.0
    for t in range(7):
        cash = scale * sum(b.values()) * ramp[t] - run * min(1, t + 0.5) - once[t]
        total += cash / (1 + r) ** (t + 1)
    return total
base = npv()
print(f"Steady-state net benefit {sum(benefit.values()) - running:.2f} per year; one-time cost {sum(one_time):.1f}")
print(f"NPV base case {base:5.2f}")
print(f"Downside (benefits 60%, one-time +20%): {npv(scale=0.6, once=[c * 1.2 for c in one_time]):5.2f}")
print(f"Upside (benefits 115%):                 {npv(scale=1.15):5.2f}")
# Tornado: move each input by 30 per cent either way and rank the swing in NPV
swings = []
for k in benefit:
    lo = dict(benefit); lo[k] *= 0.7; hi = dict(benefit); hi[k] *= 1.3
    swings.append((k, npv(b=lo), npv(b=hi)))
swings.append(("one-time cost", npv(once=[c * 1.3 for c in one_time]), npv(once=[c * 0.7 for c in one_time])))
swings.append(("running cost", npv(run=running * 1.3), npv(run=running * 0.7)))
for k, lo, hi in sorted(swings, key=lambda s: -(s[2] - s[1])):
    print(f"  {k:16s} {lo:5.2f} to {hi:5.2f}  swing {hi - lo:4.2f}")
# Break-even: how far can all benefits fall before NPV reaches zero?
lo, hi = 0.0, 1.0
for _ in range(40):
    mid = (lo + hi) / 2
    lo, hi = (mid, hi) if npv(scale=mid) < 0 else (lo, mid)
print(f"NPV is zero if benefits reach only {hi:.0%} of plan")Steady-state net benefit 5.33 per year; one-time cost 7.5 NPV base case 16.37 Downside (benefits 60%, one-time +20%): 4.26 Upside (benefits 115%): 20.41 shrink 13.43 to 19.31 swing 5.87 one-time cost 14.35 to 18.40 swing 4.05 store portfolio 14.92 to 17.82 swing 2.90 promotions 15.05 to 17.69 swing 2.63 scheduling 15.12 to 17.62 swing 2.50 running cost 15.23 to 17.51 swing 2.28 digital members 15.25 to 17.49 swing 2.24 NPV is zero if benefits reach only 39% of plan
The base case gives a net present value of about 16.4 million dollars on 7.5 million of one-time costs. A downside scenario, in which benefits reach only 60 per cent of plan and one-time costs run 20 per cent over budget, still produces a positive value of about 4.3 million. The break-even line shows that the program loses value only if benefits fall below about 39 per cent of plan. Doug reads these lines twice. The case does not depend on everything going right.
Tornado analysis
Scenarios move several inputs at once. A tornado chart moves one input at a time, by the same proportion, and ranks the inputs by how much they move the result. It answers a simple question: which assumptions matter most?
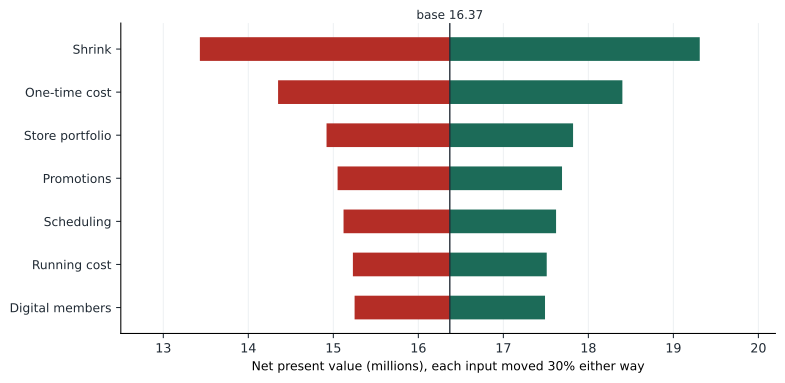
Shrink is the most important input, with a swing of about 5.9 million, followed by one-time costs. This tells the co-op where to focus management attention and measurement: the ordering rollout must work, and the projects must stay on budget. Digital members has the smallest swing, so uncertainty about it, while real, does not threaten the case. Even the worst end of every bar leaves the net present value above 13 million.
Dr. Mehta reminds the team of the limits of the method. Moving each input by 30 per cent treats all inputs as equally uncertain, which they are not: the shrink estimate rests on hard data and a realistic target, while the digital estimate rests on another co-op's experience. A better analysis would use ranges that reflect each input's actual uncertainty, which the team adds in an appendix. Tornado charts also ignore correlations: if the ordering system disappoints, both shrink and promotion savings may fall together.
Risks and how to manage them
A recommendation should name the main risks, judge their likelihood and impact, and propose how to reduce or monitor them. The team lists six.
- Ordering rollout fails or is resisted by store managers used to ordering by eye. Mitigation: pilot in three stores with willing managers, use their results to persuade others, and keep managers' authority to override suggested orders with a reason.
- Shrink savings fall short because waste is cut by reducing fresh range, harming members. Mitigation: track availability alongside shrink in the scorecard so that one is not improved at the expense of the other.
- Scheduling changes damage relations with staff and the union. Mitigation: consult the union early, achieve savings through turnover rather than layoffs, and add hours at busy times that staff and members have asked for.
- The digital program attracts few users. Mitigation: test in two stores for six months with clear targets for adoption before rolling it out; stop or redesign if targets are missed.
- Members in Store 7's town react angrily to the closure. Mitigation: hold community meetings before the decision is final, offer delivery from the nearest store for older members, and keep the fuel site open.
- One-time costs overrun. Mitigation: fixed-price contracts where possible, a contingency of 10 per cent, and stage gates at which the board approves each wave of spending.
The team presents the risks in a simple register with an owner for each, so that the board can see who will watch it. Dr. Mehta praises the honesty of the list. Boards trust recommendations that name their own weaknesses, she says. What frightens them is a plan with no visible risks, because they know there are always risks.
From option to recommendation
The final recommendation has four parts. First, the answer: adopt Member First, a three-year program to fix the core of grocery operations, win younger members through digital ordering and rewards, and reshape five losing stores. Second, the case: it is expected to raise grocery operating margin from 1.1 to about 2.8 per cent by year three, add about 5.3 million dollars a year to the co-op's savings, and allow a patronage refund of about 7.3 million at a 55 per cent payout, with a net present value of about 16 million. Third, the risks and how they will be managed. Fourth, the decisions needed now: approve the program and the first wave of spending, about 4.6 million; approve community consultation on the closure and conversions; and appoint a program director reporting to the chief executive.
The phrase decisions needed now matters. Many consulting reports end with a list of recommendations but no clear request, and boards respond by asking for more study. A recommendation that asks for specific decisions, with amounts and owners, makes it easy to say yes and hard to delay.
Funding the program
A positive net present value does not mean the co-op can pay for the program. Doug asks the team how the 7.5 million dollars of one-time costs would be financed. The team examines the co-op's cash flow: operating cash flow before patronage is about 14 million a year, with about 8 million already committed to fuel site upgrades and equipment. In the first year, when 4.6 million is needed and benefits are only starting, the program would draw partly on the co-op's credit line with its credit union; by the second year, savings from the core fixes would cover most of the spending.
The team also checks what the program means for members. The patronage refund in the first year would stay close to its current level, because savings are offset by spending; it would rise in the second year and reach about 7.3 million in the third. Hana argues that the board should explain this path to members at the annual meeting, so that members understand why the refund rises slowly at first. A co-op's owners, she points out, are also its customers, and they deserve to see how the program affects them in both roles.
Worked problem
Is the downside acceptable?
In the downside scenario, benefits reach 60 per cent of plan and one-time costs rise 20 per cent, to 9.0 million. The net present value is about 4.3 million. A director asks whether the board should still approve. How should the team answer?
Show solution
- The downside still creates value: 4.3 million is positive at the co-op's 8 per cent discount rate.
- The program loses value only if benefits fall below about 39 per cent of plan, a large margin of safety.
- Stage gates reduce exposure: the board approves spending in waves, so it can stop or adjust after the first year if results fall short, before most of the money is spent.
- The alternative, doing nothing, leaves margin at 1.1 per cent and the refund at about 4 million, with continuing pressure on the stores.
Answer: Yes: even the downside creates value, the break-even point is far below plan, and staged approval limits the co-op's exposure if early results disappoint.
Common mistakes
MistakeUse the full benchmark gaps as the benefits.
InsteadUse estimates managers believe are achievable; benchmark gaps overstate what can be captured.
MistakePresent only the base case.
InsteadShow scenarios, a tornado chart and the break-even point so the board can see how robust the case is.
MistakeTreat all inputs as equally uncertain.
InsteadUse ranges that reflect each input's real uncertainty and note correlated risks.
MistakeEnd with a list of recommendations.
InsteadEnd with the specific decisions needed now, with amounts and owners.
Summary and key terms
- A recommendation states what to do, why, what it costs and returns, what could go wrong and what must be decided now.
- Member First's steady-state net benefit is 5.33 million a year on one-time costs of 7.5 million; core fixes provide about two-thirds of the gross benefit.
- At 8 per cent over seven years the net present value is about 16.4 million; the downside is about 4.3 million and break-even is about 39 per cent of planned benefits.
- Tornado analysis shows shrink and one-time costs matter most; its limits include equal ranges and ignored correlations.
- A risk register names each risk, its mitigation and an owner; boards trust plans that name their weaknesses.
- The recommendation asks for specific decisions: approve the program and first wave of spending, consultation on stores and a program director.
- Business case
- A comparison of a decision's costs and benefits over time, usually as net present value.
- Ramp-up
- The rate at which benefits grow toward their full level after a program starts.
- Tornado chart
- A chart ranking inputs by how much each moves the result when varied one at a time.
- Break-even
- The level of an input at which net present value is zero.
- Risk register
- A list of risks with likelihood, impact, mitigation and owner.
- Stage gate
- A decision point at which approval is needed before the next wave of spending.
Practice problems
Work each problem on paper first, then reveal the answer to check.
If the steady-state net benefit were 4.5 million instead of 5.33, by roughly what share would the program's annual net benefit fall?
Show answer
By about 16 per cent, since 4.5 / 5.33 is about 0.84.
Why might shrink and promotion savings be correlated?
Show answer
Both depend partly on the ordering system and on store managers' discipline; if the rollout disappoints, both may fall together.
What is the purpose of tracking availability alongside shrink?
Show answer
To prevent stores from cutting waste by stocking less fresh food, which would harm members and sales.
Why do stage gates reduce risk?
Show answer
Money is committed in waves, so the board can stop or adjust after seeing early results before most of the spending occurs.
Lesson quiz · 5 questions
Score 60% or more to complete this lesson.
Create a free account to save your progress, take quizzes and earn a certificate.