
MBA-699 · Lesson 5 of 12 · 20 min
Analysis I: market and customer
By the fifth week the Meadowlark team has more evidence than it can use. The challenge now is analysis: turning interviews, survey responses and data into findings that answer the hypotheses. This lesson covers the market and customer side, which tests H2 on prices and H4 on younger members. The next lesson covers the financial and operational side.
Dr. Mehta reminds the team of a principle from MBA-512, where the cohort studied marketing with Dr. Lindqvist: start from the customer's point of view, not the company's. For a co-op the customer is also the owner, which makes the point sharper. Members can vote at the annual meeting, elect directors and, if unhappy, simply stop shopping, which in a small town can threaten a store's survival.
Understanding the market
The first task is to describe the market Meadowlark competes in. The team builds a simple picture of each store's trade area, the area from which most of its shoppers come, using members' postal codes from the anonymized membership file. Most small-town stores draw from within about 25 kilometres; the two largest stores, in regional cities, compete directly with national chains and discount stores within a few minutes' drive.
Census data shows two very different kinds of town. In 15 of the 22 trade areas, population is flat or falling slowly and the median age is above 45. In 7, mostly within an hour of a larger city, population is growing and many residents are young families who commute. Grace notes that these two groups of stores face different problems and may need different answers: the first group needs to keep loyal older members while running efficiently; the second needs to win younger households who have many choices.
The team then examines competition. In the growing towns, a discount supermarket or a large general merchandise store with a grocery section is usually within 20 minutes. Interviews and the survey agree that many young families do their main weekly shop at a discounter and use the co-op for top-up trips: milk, bread, fresh meat and items they forgot. This pattern explains the low share of spending better than overall dissatisfaction does, because young members rate the co-op's friendliness and local products as highly as older members do.
Testing the price hypothesis
H2 stated that members see Meadowlark's prices as too high, driving them to discount stores. The evidence is mixed, and the way the team handles it is a lesson in analysis.
Perception supports the hypothesis. In the survey, 47 per cent of members rate Meadowlark's prices as somewhat or much higher than where else they shop, and price perception was the second most common interview theme. But a basket comparison tells a different story. Grace and Daniel price a basket of 60 commonly bought items in four Meadowlark stores and at the nearest discounter and conventional supermarket. Meadowlark is about 3 per cent more expensive than the discounter on the full basket and about the same as the conventional supermarket. On the 20 items members buy most often, such as milk, eggs, bread and ground beef, Meadowlark matches the discounter within 1 per cent.
So members believe prices are much higher than they are. Why? The interviews offer clues. Promotions at the co-op are frequent but confusing, with many small discounts on items members do not buy regularly, while the discounter advertises everyday low prices on staples. Shelf tags are hard to read. And members compare their co-op receipt, which includes impulse purchases, with what they remember paying on a planned trip elsewhere. Grace concludes that the problem is less the level of prices than how they are communicated and how promotions are designed.
Dr. Mehta praises the analysis. A weaker team would have accepted the survey result and recommended price cuts, costing the co-op margin it cannot afford. Testing perception against fact, she says, is one of the most valuable things outsiders can do, because people inside an organization often accept a story everyone repeats.
Segmenting members
Segmentation divides a market into groups with similar needs or behaviour, as the cohort learned in MBA-512. The team segments active members using two variables from the membership file and survey: age band and share of grocery spending at the co-op. Four segments emerge.
- Loyal core: mostly over 55, giving the co-op more than 40 per cent of their grocery spending; about 38 per cent of active members and over half of grocery sales.
- Busy families: mostly under 45 with children, using the co-op for top-up trips; about 27 per cent of members.
- Occasional members: members of all ages who mainly buy fuel or farm supplies and rarely shop for groceries; about 24 per cent.
- Newcomers: members who joined in the last three years, often in the growing towns; about 11 per cent.
Segmentation turns the vague goal of attracting younger members into specific questions. What would it take for a busy family to make the co-op its main store for some categories, such as fresh meat and produce, even if it continues to buy packaged goods at a discounter? Survey answers suggest three things: online ordering with pickup, so a parent can collect groceries on the way home; a visible, regular reward for membership instead of a single annual refund; and a dependable range of fresh items. The team also notes what busy families do not ask for: lower prices on everything.
Share of wallet
For a retailer, share of wallet is the share of a customer's spending in a category that goes to that retailer. It is often a better target than adding new customers, because it builds on existing relationships. The team calculates it by age band using survey estimates checked against members' recorded purchases.
# Sizing click-and-collect for Meadowlark's eight largest stores (annual sales, millions)
# Top-down: start from household grocery spending in the eight trade areas.
households = 61_000
grocery_spend = 9_400          # per household per year
online_share = 0.07            # share of grocery spending ordered online in similar towns
reachable = 0.60               # share of online orders that a local store could win
top_down = households * grocery_spend * online_share * reachable / 1e6
print(f"Top-down market a local store could serve: {top_down:5.1f}")
meadowlark_share = 0.31        # Meadowlark's share of grocery spending in those areas
print(f"At Meadowlark's current share:            {top_down * meadowlark_share:5.1f}")
# Bottom-up: orders per store per week from the pilot in a similar co-op, times basket size.
stores, weeks = 8, 52
orders_per_week = 120          # per store by year three
basket = 118.0                 # dollars per online order
bottom_up = stores * orders_per_week * weeks * basket / 1e6
print(f"Bottom-up online sales by year three:     {bottom_up:5.1f}")
# How much of that is new money rather than shoppers switching from the aisles?
for incr in (0.3, 0.5):
    print(f"  incremental at {incr:.0%}: {bottom_up * incr:4.1f}")
# Share of wallet by age band from the member survey
wallet = {"under 40": 0.22, "40 to 54": 0.33, "55 and over": 0.41}
spend = {"under 40": 10_800, "40 to 54": 11_600, "55 and over": 8_300}
for band in wallet:
print(f"{band:12s} share {wallet[band]:.0%}, Meadowlark spend {wallet[band] * spend[band]:6,.0f} per household")Top-down market a local store could serve: 24.1 At Meadowlark's current share: 7.5 Bottom-up online sales by year three: 5.9 incremental at 30%: 1.8 incremental at 50%: 2.9 under 40 share 22%, Meadowlark spend 2,376 per household 40 to 54 share 33%, Meadowlark spend 3,828 per household 55 and over share 41%, Meadowlark spend 3,403 per household
The last three lines show the share-of-wallet pattern. Members under 40 give Meadowlark 22 per cent of their grocery spending, about half the 41 per cent of members aged 55 and over, and the gap of 19 points is far larger than the survey's 6.4-point margin for the younger group. Because younger households spend more on groceries in total, the gap in dollars is large: if younger members gave the co-op the same share as members aged 40 to 54, each would spend about 1,200 dollars more a year with it.
Sizing the online opportunity
H4 implies that online ordering would win spending from younger members. Before recommending an investment, the team must estimate how big the opportunity is. Market sizing uses two approaches that check each other. A top-down estimate starts from a large known total and narrows it with ratios. A bottom-up estimate builds from units the team can observe, such as orders per store. The two rarely agree, and the size of the disagreement is itself informative.
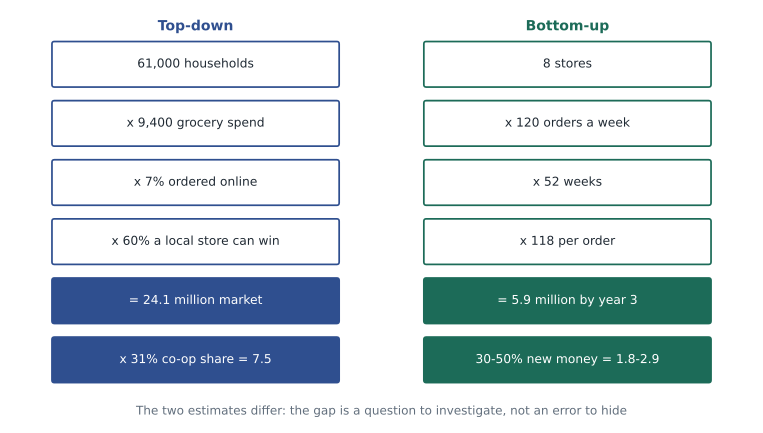
The top-down estimate starts with the 61,000 households in the trade areas of the eight largest stores, multiplies by average grocery spending, by the share of spending ordered online in similar towns, and by the share a local store could realistically serve. At the co-op's current share of local grocery spending, that suggests about 7.5 million dollars of online sales. The bottom-up estimate takes the order volume of a pilot at a similar co-op, about 120 orders per store per week by the third year, and an average basket of 118 dollars, giving about 5.9 million.
The estimates are close enough to suggest the opportunity is real and in the range of 6 to 7.5 million. But Daniel stresses the most important adjustment: much of online spending would come from members who already shop in the store and would simply change how they buy. Only the incremental share, spending that would otherwise have gone to other stores, creates new margin. The team assumes 30 to 50 per cent is incremental, giving 1.8 to 2.9 million in new sales. At a gross margin of about 24 per cent, less the cost of picking and packing orders, the direct profit is modest. The larger value lies in what online ordering might do for younger members' loyalty and share of wallet in the store.
Dr. Mehta pushes the team on its assumptions. Where did the 7 per cent online share come from? Grace found it in industry reports for similar-sized towns, but admits that online grocery is more common in cities. The team adds a sensitivity: at 4 per cent, the top-down estimate at the co-op's share falls from 7.5 to about 4.3 million. Writing assumptions down, with their sources, lets the client challenge them and update the numbers later.
Findings so far
At the second steering meeting in week seven, Hana presents the customer findings. H2 is partly refuted: prices are close to competitors on staples, but promotions and price communication create a false impression. H4 is supported: younger members spend little with the co-op, mainly for convenience and value reasons, and the survey shows strong interest in ordering online and in a more visible membership reward. Sunita, whose view on prices has been only partly confirmed, asks good questions about the basket and accepts the evidence because she saw it a day earlier. That, Dr. Mehta reminds the team, is why no vice-president should be surprised in a steering meeting.
Seeing the stores as members do
Data and surveys describe members' behaviour; visiting competitors shows what members compare the co-op with. Grace organizes store visits in the style retailers call store walks, and some call mystery shopping: team members shop at Meadowlark stores and at the nearest discounter and conventional supermarket, recording what they see as a shopper would, from parking and signs to the freshness of produce, the clarity of prices and the wait at the checkout.
The visits explain several survey results. At the discounter, prices on staples are shown in large figures on the shelf edge with a simple message; at the co-op, small tags compete with promotional signs for items few members buy. At one Meadowlark store the bakery shelves are full at seven in the evening, a sign of over-ordering that matches Daniel's shrink findings. And at every Meadowlark store the staff greet shoppers by name, something no competitor matches. Hana records these observations with photographs, taken with the store managers' permission, which later make the findings vivid for directors who rarely shop at a discounter.
Worked problem
Is the share-of-wallet gap worth chasing?
There are about 15,600 active members under 40, each spending about 10,800 dollars a year on groceries. If the co-op raised their share of wallet from 22 to 27 per cent over three years, how much additional grocery sales would result, and what gross margin would it add?
Show solution
- Additional share: 27 − 22 = 5 percentage points.
- Additional spending per member: 0.05 × 10,800 = 540 dollars a year.
- Total additional sales: 540 × 15,600 = about 8.4 million dollars.
- Gross margin at 24 per cent: 0.24 × 8.4 = about 2.0 million dollars, before the cost of the programs needed to win it.
Answer: A 5-point gain in share among younger members would add about 8.4 million of sales and 2.0 million of gross margin, which justifies a modest investment but must be weighed against program costs and realistic adoption.
Common mistakes
MistakeAccept survey perceptions as facts.
InsteadTest perceptions against data; Meadowlark's prices were close to competitors on staples despite members' belief.
MistakeAverage the top-down and bottom-up estimates when they differ.
InsteadInvestigate the gap; it reveals which assumptions need checking.
MistakeCount all online sales as new revenue.
InsteadOnly incremental spending, which would otherwise go elsewhere, adds margin.
MistakeTreat all members as one market.
InsteadSegment them; loyal older members and busy families need different offers.
Summary and key terms
- Start from the customer's view; for a co-op, customers are also owners with a vote.
- Trade-area and census analysis showed two kinds of stores: stable ageing towns and growing towns with young families.
- The price hypothesis was partly refuted: staples are priced competitively, but promotions and communication create a perception of high prices.
- Segmentation by age and share of spending identified loyal core, busy families, occasional members and newcomers.
- Members under 40 give the co-op 22 per cent of their grocery spending against 41 per cent for those 55 and over.
- Top-down and bottom-up sizing put online sales at about 6 to 7.5 million; only the incremental share adds new margin.
- Trade area
- The geographic area from which a store draws most of its customers.
- Share of wallet
- The share of a customer's spending in a category that goes to one retailer.
- Segmentation
- Dividing a market into groups with similar needs or behaviour.
- Top-down sizing
- Estimating a market by narrowing a large known total with ratios.
- Bottom-up sizing
- Estimating a market by building up from observable units such as orders per store.
- Incremental sales
- Sales that would not have occurred without the initiative.
Practice problems
Work each problem on paper first, then reveal the answer to check.
If the online share in the top-down estimate were 5 per cent instead of 7, what would the market a local store could serve be?
Show answer
61,000 × 9,400 × 0.05 × 0.60 = about 17.2 million, and 5.3 million at the co-op's 31 per cent share.
Why might members believe prices are higher than they are?
Show answer
Confusing promotions, hard-to-read tags, comparing impulse-filled co-op receipts with planned trips elsewhere, and discounters' strong everyday low price messages.
Which segment should an online pickup service mainly target, and why?
Show answer
Busy families, because they value convenience, already shop the co-op for top-ups and have the largest gap in share of wallet.
Online sales are 5.9 million, 40 per cent incremental, gross margin 24 per cent and picking costs 0.45 million. What is the direct profit?
Show answer
0.40 × 5.9 × 0.24 = 0.57 million gross margin, minus 0.45 = about 0.12 million.
Lesson quiz · 5 questions
Score 60% or more to complete this lesson.
Create a free account to save your progress, take quizzes and earn a certificate.