
MBA-699 · Lesson 11 of 12 · 20 min
Storylining and slide craft
Two weeks before the board meeting, the Meadowlark team prints its draft presentation, 54 slides, and pins every page to the wall of a seminar room. Dr. Mehta walks along the wall reading only the titles. When she reaches the end she says: I have read your whole presentation and I still do not know what you are recommending. Your titles are labels: Grocery margin, Survey results, Store analysis, Next steps. A director who reads only the titles, which is what most directors do, will learn nothing.
This lesson covers how consultants turn a synthesis into a storyline and a storyline into slides and a written report that persuade. The craft matters because the best analysis has no value if the client does not understand and act on it.
From pyramid to storyline
A storyline is the sequence of messages a presentation will deliver, one per slide, written out before any slide is designed. It follows directly from the pyramid in lesson 7: the governing thought becomes the opening message, the key arguments become sections, and the evidence becomes the slides within each section. Writing the storyline as a list of full-sentence messages lets the team check the logic before investing hours in charts.
Many consultants test a storyline by reading the messages aloud in order. Each should follow from the one before, and together they should tell the whole story. This is sometimes called horizontal logic: reading across the slide titles, the argument should hold. Vertical logic is the relationship within each slide: everything on the slide should support its title. A presentation needs both.
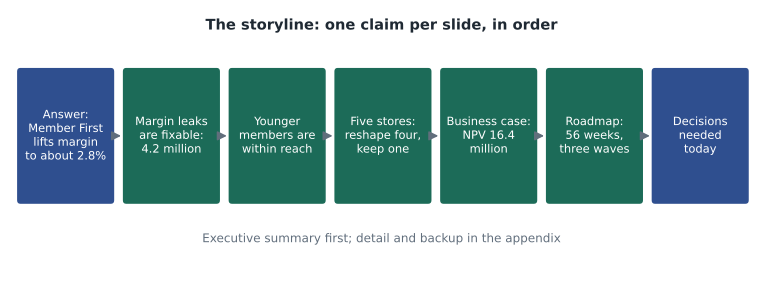
The team rewrites its storyline in one afternoon. The presentation will open with a one-slide executive summary stating the recommendation and its main reasons. Three sections follow, one for each key argument. A business case section and a roadmap section come next. The presentation ends with the decisions needed. Everything else, including the survey method, the full profit tree and the detailed scoring, moves to an appendix, where it is available for questions but does not slow the main story. The main presentation shrinks from 54 slides to 16.
Dr. Mehta explains why the cut matters. A board meeting has perhaps 40 minutes for the item, including discussion. A presentation of 54 slides leaves no time for the discussion, which is where directors test the recommendation and come to own it. A good rule is to plan for presenting no more than half the available time.
Action titles
An action title is a full sentence that states the single claim a slide proves. 'Grocery margin' is a label; 'Shrink is the largest leak: 4.1 per cent of sales against 2.7 per cent at peer co-ops' is an action title. Action titles do three things. They tell the audience what to conclude, so nobody misreads the chart. They force the team to know what each slide proves, which exposes slides that prove nothing. And they make the presentation readable from the titles alone, which suits busy directors who skim.
Daniel writes a short check to apply some mechanical tests to the team's draft titles.
import re
# A simple check of a draft storyline: each slide title should be a full claim, short, and
# carry a number or a clear verb, so that reading the titles alone tells the story.
titles = [
    "Grocery margin",
    "Shrink is the largest leak: 4.1% of sales against 2.7% at peer co-ops",
    "Members under 40 spend 22% of their grocery budget with us, half the share of older members",
    "Survey results",
    "Five stores lose 1.9 million a year, but only one has no community role",
    "We recommend Member First: fix the core, go digital and reshape five stores",
    "There are a number of different considerations regarding the potential implementation timeline going forward",
]
verbs = r"\b(is|are|lose|spend|recommend|cut|grow|raise|fall|rise|need|will|can|pays|adds)\b"
for i, t in enumerate(titles, 1):
    words = len(t.split())
    flags = []
    if words < 5: flags.append("topic label, not a claim")
    if words > 16: flags.append(f"too long ({words} words)")
    if not re.search(verbs, t, re.I): flags.append("no verb")
    if not re.search(r"\d", t) and words >= 5: flags.append("no number")
print(f"{i}. {'ok' if not flags else ', '.join(flags)}")1. topic label, not a claim, no verb 2. ok 3. too long (17 words) 4. topic label, not a claim, no verb 5. ok 6. no number 7. no number
The check flags the two label titles, a title that has grown too long, and two titles without numbers. But Daniel points out its limits. Title 7, 'There are a number of different considerations regarding the potential implementation timeline going forward', passes most tests yet says nothing at all; it is padding dressed as a sentence. Title 6, 'We recommend Member First: fix the core, go digital and reshape five stores', is flagged for having no number but is a perfectly good opening title. Mechanical checks catch some problems but cannot judge whether a title makes a clear, true claim. That still requires a reader.
The team rewrites title 7 as 'The program takes 56 weeks; the member app sets the end date', and shortens title 3 to 'Members under 40 give us 22% of their grocery spending, half the share of older members'. Grace adds a further rule: titles should be claims the evidence supports, no stronger. 'Members hate our prices' would be a vivid title but false; 'Members think our prices are higher than they are' is accurate and more useful.
Anatomy of a slide
Most consulting slides share a simple structure: an action title, a body that provides evidence for it, usually a single chart or table, a few callouts that tell the reader what to notice, and a source line. The figure shows the anatomy and four rules the team adopts.
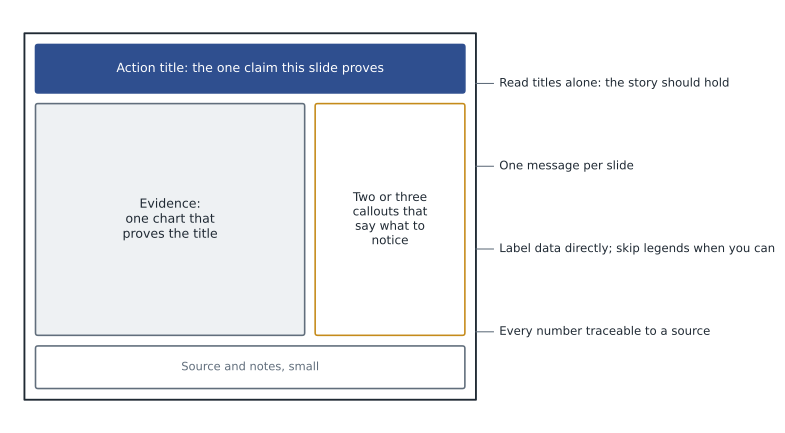
One message per slide is the hardest rule to follow, because teams want to show everything they found. A slide with three charts and four messages makes the reader decide what matters, which is the team's job. When a slide needs two messages, it should usually become two slides.
Choosing charts
Gene Zelazny, for many years director of visual communications at McKinsey, argued in Say It with Charts that the choice of chart should follow from the comparison the message makes, not from habit. A message about ranking, such as which cost gaps are largest, calls for a bar chart sorted by size. A message about change over time calls for a line or column chart. A message about parts of a whole calls for a stacked bar or, sparingly, a pie. A message about correlation calls for a scatter plot. A message about how a total is built up or broken down, such as the business case, calls for a waterfall.
Edward Tufte, the statistician and writer on information design, added a principle the team takes to heart: maximize the share of ink that shows data, and remove decoration that does not. Three-dimensional effects, heavy gridlines, unnecessary legends and decorative images make charts harder to read. Labelling bars and lines directly is usually clearer than a legend, and a single accent shade can draw the eye to the point of the chart.
The team also checks every chart for honesty. Bar charts start at zero, because bar length represents value. Scales are consistent when charts are compared. Percentages state their base. Small samples, such as the 236 younger members in the survey, carry a note on their margin of error. Dr. Mehta tells the team that a misleading chart, even one made by accident, can destroy credibility in seconds if a director notices it.
The executive summary and the written report
The executive summary is the most important page the team will write. Many directors read nothing else. It follows the pyramid: the recommendation in the first sentence, the three key arguments with their main numbers, the business case in two lines, and the decisions needed. The team writes it in 220 words and tests it on Dr. Mehta, who reads it in under a minute and can state the recommendation afterwards.
The written report expands the presentation for readers who want the detail, especially Doug's finance team and the managers who will carry out the program. It uses the same structure and the same titles as headings, so readers can move between the two. The appendix holds the method, the data sources and adjustments, the full analysis and the source log. A report that a capable reader could use to check and update the analysis is more valuable to the client than one that only impresses.
Pre-wiring and rehearsal
Consultants rarely present a recommendation to a board cold. Pre-wiring means meeting key stakeholders individually before the formal presentation, showing them the findings and recommendation, hearing their concerns and adjusting where they are right. The team pre-wires with each vice-president, with Agnes Wiebe as board chair, and with the director who had favoured partnering out the stores. That director remains unconvinced but appreciates seeing the evidence from the regional grocers, and says he will not oppose the recommendation. No director will be surprised at the meeting.
The team rehearses three times, once in front of the Cedarline team, who play hostile directors. The rehearsals expose two problems: Hana speaks too fast through the member findings, and nobody has a crisp answer to the question 'What happens if the app fails?' The team adds a backup slide on the stop-or-redesign rule for the digital pilot and agrees who will answer which questions.
Leo and Owen's storyline for Cedarline faces a different challenge: their audience, Cedarline's executives, have already approved each plan individually, so the story is not about whether to act but about order and limits. Their opening title is 'Doing everything at once would overload the warehouse; a people-first sequence captures most of the value with less risk.' Dr. Mehta calls it the best title she has seen this year, because it states a surprising claim and its consequence in one sentence.
Writing for different readers
The same findings must reach several audiences: directors who want the decision and its risks; executives who want to know what it means for their divisions; store managers who will carry out the changes; and members, who will hear about the plan at the annual meeting. The team prepares different versions from the same storyline rather than one document for everyone. The board receives the 16-slide presentation and the report. Sunita receives a version focused on the stores, with each store's figures. Tyler receives a short plain-language summary he can adapt for members, which avoids words like shrink and contribution.
The team uses an AI writing tool to produce first drafts of the plain-language summary, with Colin's permission and without any confidential data in the prompt. The drafts are fluent but generic, and twice they state numbers that do not match the analysis. Grace rewrites the summary using the drafts only as a starting point. Her rule for AI drafts matches Dr. Mehta's rule for the whole engagement: useful for speed, never trusted for facts.
Worked problem
Rewriting a slide
A draft slide is titled 'Survey results'. It contains three charts: members' rating of prices, share of spending by age band and interest in online ordering by age band. Rewrite it according to the lesson.
Show solution
- Identify the messages. There are three: members think prices are higher than they are; younger members give the co-op much less of their spending; younger members are most interested in online ordering.
- One message per slide: split it into three slides, or keep the two messages about younger members together only if they make one claim.
- Write action titles, for example: 'Members think our prices are higher than they are; on staples we match the discounter' and 'Younger members give us 22% of their grocery spending and are the most interested in ordering online'.
- Choose charts that fit the comparison: a bar chart comparing perceived and actual price gaps; a bar chart of share of wallet by age band with the subgroup margin of error noted.
Answer: Replace one crowded label slide with two or three slides, each with an action title and one chart that proves it.
Common mistakes
MistakeDesign slides first and write titles later.
InsteadWrite the storyline as full-sentence messages first, then build each slide to prove its title.
MistakeUse topic labels as slide titles.
InsteadUse action titles that state the claim, so the story can be read from the titles alone.
MistakeShow everything you found in the main presentation.
InsteadKeep the main story short and move supporting detail to an appendix.
MistakeLet mechanical checks judge titles.
InsteadChecks catch some problems, but only a reader can judge whether a title makes a clear, true claim.
Summary and key terms
- A storyline is the sequence of slide messages, derived from the pyramid and checked for horizontal and vertical logic.
- Action titles state the single claim each slide proves; the presentation should be readable from titles alone.
- Each slide has one message, one chart that proves it, a few callouts and a source.
- Chart choice follows the comparison: ranking, time, parts of a whole, correlation or build-up; charts must be honest.
- The executive summary states the recommendation first; the written report and appendix let readers check and update the work.
- Pre-wiring key stakeholders and rehearsing with hostile questions prevent surprises at the decision meeting.
- Storyline
- The sequence of messages a presentation will deliver, written before slides are designed.
- Action title
- A full-sentence slide title that states the claim the slide proves.
- Horizontal logic
- The flow of the argument when slide titles are read in order.
- Vertical logic
- The support each element of a slide gives to its title.
- Executive summary
- A one-page statement of the recommendation, its reasons and the decisions needed.
- Pre-wiring
- Meeting key stakeholders individually before a formal presentation to share and test findings.
Practice problems
Work each problem on paper first, then reveal the answer to check.
Rewrite the label title 'Store analysis' as an action title using the lesson's findings.
Show answer
For example: 'Five stores lose 1.9 million a year, but only one has no community role and can close.'
Which chart type best shows how the business case's net benefit is built from its parts?
Show answer
A waterfall chart, which shows each positive and negative component building to the total.
Why should a team plan to present for no more than about half the time available?
Show answer
Discussion is where directors test and come to own the recommendation; a presentation that fills the time leaves none for it.
What is pre-wiring, and what is its main benefit?
Show answer
Sharing findings with key stakeholders individually before the meeting; it surfaces concerns early and prevents surprises that turn allies into opponents.
Lesson quiz · 5 questions
Score 60% or more to complete this lesson.
Create a free account to save your progress, take quizzes and earn a certificate.