
MBA-602 · Lesson 6 of 12 · 22 min
Unit economics and the path to profitability
Dr. Marchetti begins the sixth session with a slide showing two startups, each with revenue growing at 15 per cent a month. One is building a valuable business; the other is buying revenue at a loss on every customer and will run out of money in nine months. From the revenue line alone, she says, an investor cannot tell them apart. The difference lies in unit economics: what the venture earns, after the costs that vary with each sale, on each unit, order or customer, and what it costs to win that customer in the first place. If each unit loses money, growth makes the losses larger. If each unit earns a healthy margin and customers are cheap to acquire, growth leads to profit once volume covers the fixed costs.
Contribution per unit
The starting point is contribution margin per unit, which the cohort met in MBA-501 as price minus variable cost. For a venture, variable cost includes every cost that rises with volume: materials, the labour that goes into each job, payment processing, packaging, shipping and any commission paid to a channel partner. It excludes fixed costs such as rent, salaried staff and software that do not change with volume in the short run. The distinction is not always obvious. Technicians paid by the hour are a variable cost if their hours flex with demand, but a fixed cost if the venture must keep them on through slow months.
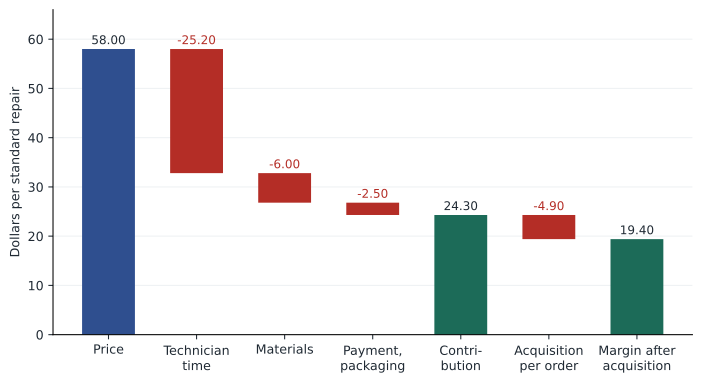
For a standard Second Ascent repair, the experiments gave the figures needed. The average consumer ticket is 58 dollars. Labour averages about 0.9 hours at a fully loaded wage of 28 dollars an hour, or about 25.20 dollars. Materials and parts average 6 dollars, and payment processing and packaging about 2.50 dollars. Contribution is therefore about 24.30 dollars per repair, a contribution margin of about 42 per cent. Brand repairs earn less, about 14.50 dollars each, because the fee per repair is lower, while refurbished items sold for resale earn the most, about 51 dollars each, though they require cash to be tied up in inventory.
Customer acquisition cost
Customer acquisition cost, or CAC, is the total cost of winning a new paying customer: advertising, promotions, partner fees, sales salaries and any free first service, divided by the number of new customers won. It should be measured by channel, because channels differ greatly, and it should be fully loaded, including the people and tools used for marketing and sales, not just the advertising spend. A common mistake is to calculate a blended CAC across all channels, including customers who arrived through word of mouth at no cost. The blended figure looks low, but it hides the cost of the channels the venture will have to rely on when it grows beyond its first, enthusiastic customers.
Second Ascent's smoke test gave early CAC estimates by channel. Outdoor club newsletters cost about 14 dollars per new paying customer, including a small sponsorship fee and a first-repair discount; Cedarline referrals cost about 9 dollars, mostly the cost of a referral card and a discount; specialty shops that host drop-off bins cost about 18 dollars, including a commission; and search advertising cost about 41 dollars. The founders treat these as provisional, since early adopters are usually cheaper to reach than later customers and CAC tends to rise as a venture saturates its best channels.
Customer lifetime value
Customer lifetime value, or LTV, estimates the contribution a customer generates over the whole relationship, discounted to the present. The cohort used a version of this measure in MBA-512. For a venture with annual purchases, a simple formula assumes that each customer generates contribution m in the first year, that a constant share r of customers remains active each subsequent year, and that future contribution is discounted at rate d. Including the first year's contribution, the value of a customer is then m times one plus d, divided by one plus d minus r.
The formula is sensitive to the retention rate. With contribution of 40 dollars a year and a 12 per cent discount rate, raising retention from 40 to 60 per cent raises lifetime value from about 62 to about 86 dollars. In practice, founders should estimate retention from cohort data as soon as they have it, rather than assume it, and should be cautious about extrapolating early cohorts, which are often more loyal than later ones. For a venture with few repeat purchases, such as one selling a product people buy once, lifetime value is close to the first-purchase contribution, and the case for spending heavily on acquisition is much weaker.
LTV, CAC and payback
Two ratios summarize the relationship between value and cost. The LTV-to-CAC ratio compares the value of a customer with the cost of acquiring one. Investors in subscription businesses often look for a ratio of about three or more; a ratio near one means the venture is spending almost all of a customer's value to win them. The CAC payback period measures how long it takes for a customer's contribution to repay its acquisition cost, which matters for cash: a venture with a twelve-month payback must finance a year of acquisition spending before it gets its money back, while one with a three-month payback can grow largely on its own cash. Both ratios are rough guides rather than rules, and both depend on the quality of the retention estimate.
# Second Ascent: lifetime value, LTV/CAC and payback by acquisition channel
d = 0.12                     # annual discount rate
per_order = 24.30            # contribution per consumer repair
channels = {
    # channel: (CAC, orders a year per active customer, annual retention)
    "Outdoor clubs":       (14, 1.7, 0.58),
    "Cedarline referrals": ( 9, 1.6, 0.55),
    "Specialty shops":     (18, 1.5, 0.50),
    "Search ads":          (41, 1.3, 0.38),
}
for name, (cac, orders, r) in channels.items():
    m = per_order * orders                     # contribution per active customer per year
    ltv = m * (1 + d) / (1 + d - r)
    payback = cac / (m / 12)
    print(f"{name:<20} CAC {cac:3d}  margin/yr {m:5.1f}  LTV {ltv:5.1f}  LTV/CAC {ltv / cac:4.1f}  payback {payback:4.1f} months")

# Sensitivity of LTV to retention for the clubs channel
m = per_order * 1.7
for r in (0.40, 0.50, 0.58, 0.70):
print(f" retention {r:.0%}: LTV {m * (1 + d) / (1 + d - r):5.1f}")Outdoor clubs CAC 14 margin/yr 41.3 LTV 85.7 LTV/CAC 6.1 payback 4.1 months Cedarline referrals CAC 9 margin/yr 38.9 LTV 76.4 LTV/CAC 8.5 payback 2.8 months Specialty shops CAC 18 margin/yr 36.5 LTV 65.8 LTV/CAC 3.7 payback 5.9 months Search ads CAC 41 margin/yr 31.6 LTV 47.8 LTV/CAC 1.2 payback 15.6 months retention 40%: LTV 64.3 retention 50%: LTV 74.6 retention 58%: LTV 85.7 retention 70%: LTV 110.2
The results confirm what the smoke test suggested. Club and Cedarline referral customers are worth several times what they cost, with payback periods of three to four months. Shop customers are less valuable but still attractive. Search advertising barely pays for itself, with an LTV-to-CAC ratio just above one and a payback period of more than a year, because search customers both cost more and return less often. Grace notes that the search results would look much better if she used the blended CAC across all channels, which is exactly the trap Dr. Marchetti warned about. The founders decide to spend nothing on search advertising until they can lower its cost or raise its retention, and to build the club, shop and Cedarline channels first.
Fixed costs and breakeven
Contribution must ultimately cover fixed costs. Second Ascent's fixed costs in its first year of full operation are modest by startup standards: workshop rent in Cedarline's distribution centre, two founder salaries, a workshop supervisor from the second year, insurance, software and a base marketing budget. The founders estimate fixed costs of about 16,000 dollars a month for the first six months, while Grace remains part-time, rising to 23,500 dollars when she joins full-time and about 28,000 dollars from the second year. With an average contribution of about 22 dollars per job across consumer, brand and refurbishment work, monthly breakeven requires about 1,070 jobs at the first-year cost level and about 1,270 at the second-year level.
Breakeven volume is a useful number to put next to capacity. If breakeven requires the workshop to run close to full capacity, the venture is fragile: a slow month or a staffing gap pushes it into loss. Second Ascent's workshop can handle about 2,000 jobs a month with ten technicians, so breakeven at about 1,270 leaves a reasonable margin. Operating leverage, the cohort will recall, works in both directions. Once fixed costs are covered, each additional job adds its full contribution to profit, but below breakeven each lost job deepens the loss.
Burn, runway and the J-curve
Most new ventures lose money before they make it, and the shape of cumulative cash over time is often called a J-curve: it falls while the venture spends on equipment, people and customer acquisition, reaches a low point, and then rises as contribution overtakes fixed costs. The depth of the curve's low point is roughly the amount of capital the venture needs to raise, plus a cushion. Burn rate is the net cash the venture consumes each month, and runway is the number of months the cash in hand will last at the current burn. Founders watch both obsessively, because a venture that runs out of cash dies regardless of how promising it is.
# Second Ascent: monthly cash model for three years after launch (dollars)
capex = 85_000                    # sewing and seam-taping machines, workbenches, fit-out
cash, low, low_month = -capex, -capex, 0
first_profit = payback_month = None
for month in range(1, 37):
    jobs = min(2000, 250 + 1750 * (month - 1) / 29)        # ramp to capacity by month 30
    fixed = 16_000 if month <= 6 else (23_500 if month <= 18 else 28_000)
    net = jobs * 22.0 - fixed
    cash += net
    if cash < low: low, low_month = cash, month
    if first_profit is None and net > 0: first_profit = month
    if payback_month is None and cash > 0: payback_month = month
    if month % 6 == 0:
        print(f"month {month:2d}: jobs {jobs:5.0f}  monthly net {net:8,.0f}  cumulative cash {cash:9,.0f}")
print(f"Lowest cumulative cash {low:,.0f} in month {low_month}")
print(f"First profitable month: {first_profit}; cumulative cash turns positive in month {payback_month}")month 6: jobs 552 monthly net -3,862 cumulative cash -128,086 month 12: jobs 914 monthly net -3,397 cumulative cash -168,379 month 18: jobs 1276 monthly net 4,569 cumulative cash -160,879 month 24: jobs 1638 monthly net 8,034 cumulative cash -132,586 month 30: jobs 2000 monthly net 16,000 cumulative cash -56,500 month 36: jobs 2000 monthly net 16,000 cumulative cash 39,500 Lowest cumulative cash -171,190 in month 14 First profitable month: 15; cumulative cash turns positive in month 34
The model shows the J-curve clearly. Cumulative cash falls to about minus 171,000 dollars in month 14, the venture makes its first monthly profit in month 15, and cumulative cash turns positive in month 34. The founders therefore need to fund at least about 170,000 dollars of losses and equipment, and Dr. Marchetti recommends raising enough to cover the low point plus six months of fixed costs as a cushion against delays, since ramp-ups almost always take longer than planned. That suggests a first raise of roughly 300,000 to 350,000 dollars if the plan stays this lean. Lesson 9 will show that a faster plan, opening a second city sooner, would need much more and would change the kind of investor the founders should approach.
Default alive or default dead
Paul Graham, a co-founder of the startup accelerator Y Combinator, suggested in a 2015 essay that every founder should know whether the company is default alive or default dead: if expenses stayed constant and revenue kept growing at its recent rate, would the company reach profitability before its money ran out? A default-dead company depends on raising more money, which may not be available when it is needed. Graham argued that many founders do not know the answer, and that the question becomes urgent long before the bank balance looks alarming, because raising money takes months.
The idea connects unit economics to strategy. A venture with sound unit economics can choose between growing slowly on its own revenue and raising capital to grow faster. A venture with poor unit economics has no such choice: growth deepens its losses, and it depends entirely on investors. Dr. Marchetti says the venture market of the past few years has punished the second kind severely. Investors who once funded rapid growth at almost any cost now ask early and in detail for contribution margins, payback periods and a credible path to profitability, except in a few sectors such as artificial intelligence where they are betting on very large future markets.
Improving unit economics
Founders have several levers. Price is often the most powerful and the most neglected: early ventures tend to underprice out of fear, and a small increase in price falls directly into contribution. Mix can be managed by steering customers toward higher-margin services, such as express repairs or annual plans. Variable cost can fall with experience and standardization; Marta expects labour per zipper repair to fall by about a fifth as technicians specialize and the workshop sets up dedicated stations. Acquisition cost can fall by shifting to cheaper channels and by encouraging referrals. Retention can rise with good service, repair histories that make the next visit easier and member programs.
Dr. Marchetti warns against two shortcuts. The first is to assume that scale will fix poor unit economics. Scale reduces fixed cost per unit and sometimes variable cost, but it rarely turns a negative contribution positive, and it often raises acquisition costs as the venture exhausts its best channels. The second is to cut quality to cut cost. For Second Ascent, skilled repair is the value proposition; a cheaper repair that fails on the next trip would destroy the reputation on which every channel depends.
Worked problem
Is the express tier worth it?
Second Ascent is considering an express tier: repairs within three working days for 25 dollars extra. Express jobs take the same labour as standard ones but cause an estimated 0.15 hours of disruption to the workshop schedule per job, at 28 dollars an hour. The founders expect 18 per cent of consumer customers to choose express, of whom one-third would otherwise not have used Second Ascent at all because their trip was too soon. Estimate the effect on contribution per 1,000 consumer repairs.
Show solution
- Extra contribution per express job from existing customers: 25 minus disruption cost 0.15 × 28 = 4.20, so about 20.80 dollars.
- Out of 1,000 standard customers, 18 per cent choose express: 180 jobs. Two-thirds, or 120, would have bought anyway, adding 120 × 20.80 ≈ 2,496 dollars.
- One-third, or 60, are new customers who would otherwise have gone elsewhere. Each adds the full standard contribution of 24.30 plus the express margin of 20.80, so 45.10 each, about 2,706 dollars.
- Total extra contribution per 1,000 consumer repairs: about 5,200 dollars, or about 5.20 per repair, on a base of 24,300.
Answer: The express tier raises contribution by roughly a fifth, provided the disruption estimate holds. Because express jobs jump the queue, the founders should cap the share of express work in peak weeks, as operations theory predicts that disruption costs rise steeply when the workshop is nearly full.
Common mistakes
MistakeRevenue growth shows a venture is healthy.
InsteadWithout positive unit economics, growth deepens losses; look at contribution per unit, CAC and payback.
MistakeUse one blended acquisition cost across all channels.
InsteadMeasure CAC by channel and fully loaded; blended figures hide expensive channels.
MistakeLifetime value can be estimated before any customers return.
InsteadLTV depends heavily on retention; estimate it from cohort data and be cautious with early cohorts.
MistakeScale will fix poor unit economics.
InsteadScale spreads fixed costs but rarely turns negative contribution positive, and it often raises acquisition costs.
Summary and key terms
- Unit economics measure what a venture earns on each unit or customer after variable costs, and what it costs to acquire them.
- Customer acquisition cost should be measured by channel and fully loaded.
- Lifetime value depends on annual contribution, retention and the discount rate; LTV-to-CAC and payback summarize whether acquisition pays.
- Breakeven volume should be compared with capacity; operating leverage magnifies gains and losses.
- Cumulative cash follows a J-curve; its low point, plus a cushion, sets how much capital the venture needs.
- Default-alive ventures can choose how fast to grow; price, mix, cost, channels and retention are the main levers.
- Contribution per unit
- Price minus all costs that vary with each unit sold.
- Customer acquisition cost
- The fully loaded cost of winning one new paying customer.
- Lifetime value
- The discounted contribution a customer is expected to generate over the relationship.
- CAC payback
- The months of contribution needed to repay the cost of acquiring a customer.
- Burn rate
- Net cash consumed each month.
- Runway
- The number of months the cash in hand will last at the current burn rate.
- J-curve
- The pattern of cumulative cash that falls during early losses and rises as the venture becomes profitable.
Practice problems
Work each problem on paper first, then reveal the answer to check.
A repair costs 30 dollars in labour, 5 in parts and 2 in payment fees and sells for 65. What is the contribution and contribution margin?
Show answer
Contribution = 65 − 37 = 28 dollars; margin = 28 / 65 ≈ 43 per cent.
A customer generates 50 dollars of contribution a year, retention is 60 per cent and the discount rate 10 per cent. What is the lifetime value using the formula in this lesson?
Show answer
LTV = 50 × 1.10 / (1.10 − 0.60) = 55 / 0.50 = 110 dollars.
If CAC is 30 dollars and annual contribution per customer is 40 dollars, what is the CAC payback period?
Show answer
30 / (40 / 12) = 9 months.
A venture has 400,000 dollars in the bank and burns 25,000 a month. What is its runway, and why should it start raising money well before the end?
Show answer
16 months; raising money typically takes several months, and a venture negotiating with little runway left has little bargaining power.
Lesson quiz · 5 questions
Score 60% or more to complete this lesson.
Create a free account to save your progress, take quizzes and earn a certificate.