
MBA-512 · Lesson 10 of 12 · 21 min
Marketing analytics: customer lifetime value, attribution and A/B testing
Grace Mwangi's finance director has asked a pointed question about Fairway's loyalty program. It costs about 14 million dollars a year in points, technology and staff, and 2.1 million households belong to it. Members spend far more than non-members, which the marketing team presents as proof that the program works. The finance director replies that big spenders were always more likely to join. Grace wants to know how to answer, and more broadly how to judge which customers, channels and campaigns are worth what Fairway spends on them. Dr. Lindqvist says the answer requires three tools that every marketing manager should be able to use, or at least to question: customer lifetime value, attribution and experiments.
Marketing analytics is the use of data and quantitative methods to measure and improve the results of marketing decisions. It sits at the meeting point of this course and MBA-504: the statistics are the same, but the questions are about customers, channels and campaigns. The danger, as in lesson 9, is to measure what is easy rather than what matters. This lesson shows how to put a value on customers, how to share credit among the marketing activities that influence them, and how to test whether a change actually works.
Customers as assets
Customer lifetime value, CLV, is the present value of the margins a customer is expected to generate over their relationship with the firm, net of the cost of serving and retaining them. Thinking of customers this way, as Sunil Gupta and Donald Lehmann argued in Managing Customers as Investments in 2005, connects marketing to the valuation methods the cohort learned in MBA-511. A customer acquired today is like a small project: an upfront acquisition cost followed by a stream of uncertain future cash flows that ends when the customer leaves.
In a simple model, a customer generates margin m each year, stays from one year to the next with probability r, the retention rate, and future margins are discounted at rate i. If margins arrive at the end of each year the customer remains active, the expected value of the first year's margin is m divided by one plus i, of the second year m times r divided by one plus i squared, and so on. Summed over an indefinite horizon, the series has a simple closed form.
The formula shows why retention matters so much. With a margin of 80 dollars a year and a discount rate of 9 per cent, a customer retained at 50 per cent is worth about 135 dollars, and at 70 per cent about 205 dollars: a 20-point improvement in retention raises value by half. In a study published in 2004, Gupta, Lehmann and Jennifer Ames Stuart estimated customer values for several public companies and found that, for the firms they studied, a 1 per cent improvement in retention raised firm value by about 5 per cent, far more than a 1 per cent improvement in margin or in acquisition cost.
Three cautions apply. First, retention rates estimated from a whole customer base usually rise over time for a cohort, because the least loyal customers leave first, so a single average rate understates the value of surviving customers and overstates the value of new ones. Second, in non-contractual settings such as retail, the firm never observes customers leaving; they simply stop buying. Models such as the Pareto/NBD model of David Schmittlein, Donald Morrison and Richard Colombo, published in 1987, and the simpler BG/NBD model of Peter Fader, Bruce Hardie and Ka Lok Lee in 2005, estimate each customer's probability of still being active from the recency and frequency of their purchases. Third, CLV is a forecast, sensitive to assumptions, and should be compared across groups rather than treated as a precise number.
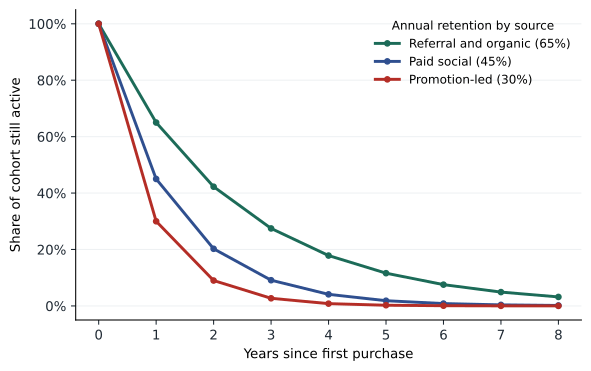
Cedarline's data, analysed by acquisition source, show large differences. Customers who first came through referrals or by searching for Cedarline unprompted spend more and stay longer than those acquired through paid social advertising, and customers first acquired through a promotion stay for the shortest time of all, consistent with research finding that customers acquired through price promotions tend to have lower lifetime value. The first part of the code computes CLV, the customer acquisition cost, CAC, and the ratio of the two by source.
import math, itertools
from statistics import NormalDist
# 1. Customer lifetime value by acquisition source (Cedarline, annual margins in dollars)
def clv(m, r, i=0.09, years=20):
    # margin m received at the end of each year the customer is still active; retention r
    return sum(m * r ** (t - 1) / (1 + i) ** t for t in range(1, years + 1))
sources = {'Referral and organic': (82, 0.65, 15), 'Paid social': (74, 0.45, 60), 'Promotion-led': (55, 0.30, 40)}
print(f"{'Source':22}{'CLV':>7}{'CAC':>6}{'CLV-CAC':>9}{'CLV/CAC':>9}")
for s, (m, r, cac) in sources.items():
    v = clv(m, r)
    print(f"{s:22}{v:7.0f}{cac:6}{v - cac:9.0f}{v / cac:9.1f}")

# 2. Shapley-value attribution: conversions per 1,000 journeys for each set of channels
v = {(): 0, ('Search',): 100, ('Social',): 40, ('Email',): 60,
     ('Search', 'Social'): 170, ('Email', 'Search'): 180, ('Email', 'Social'): 110,
     ('Email', 'Search', 'Social'): 250}
chans = ['Search', 'Social', 'Email']
key = lambda s: tuple(sorted(s))
shap = {c: 0.0 for c in chans}
orders = list(itertools.permutations(chans))
for order in orders:
    seen = []
    for c in order:
        shap[c] += (v[key(seen + [c])] - v[key(seen)]) / len(orders)
        seen.append(c)
last_touch = {'Search': 0.60, 'Social': 0.10, 'Email': 0.30}
for c in chans:
    print(f"{c:7} Shapley {shap[c]:5.1f} ({shap[c] / 250:.0%})   last touch {last_touch[c]:.0%}")

# 3. A/B test: product page with a fit guide (conversion of 40,000 visitors per arm)
n1, x1, n2, x2 = 40000, 1240, 40000, 1352
p1, p2 = x1 / n1, x2 / n2
p = (x1 + x2) / (n1 + n2)
z = (p2 - p1) / math.sqrt(p * (1 - p) * (1 / n1 + 1 / n2))
pval = 2 * (1 - NormalDist().cdf(abs(z)))
se = math.sqrt(p1 * (1 - p1) / n1 + p2 * (1 - p2) / n2)
print(f"Conversion {p1:.2%} vs {p2:.2%}; lift {p2 / p1 - 1:.1%}; z = {z:.2f}; p = {pval:.3f}")
print(f"95% interval for the difference: {p2 - p1 - 1.96 * se:.2%} to {p2 - p1 + 1.96 * se:.2%}")
# visitors per arm needed to detect a lift from 3.10% to 3.30% with 80% power at 5% significance
pa, pb = 0.031, 0.033
za, zb = 1.96, NormalDist().inv_cdf(0.80)
n = (za * math.sqrt(2 * pa * (1 - pa)) + zb * math.sqrt(pa * (1 - pa) + pb * (1 - pb))) ** 2 / (pb - pa) ** 2
print(f"Visitors per arm to detect 3.10% -> 3.30%: {n:,.0f}")Source CLV CAC CLV-CAC CLV/CAC Referral and organic 186 15 171 12.4 Paid social 116 60 56 1.9 Promotion-led 70 40 30 1.7 Search Shapley 121.7 (49%) last touch 60% Social Shapley 56.7 (23%) last touch 10% Email Shapley 71.7 (29%) last touch 30% Conversion 3.10% vs 3.38%; lift 9.0%; z = 2.24; p = 0.025 95% interval for the difference: 0.03% to 0.53% Visitors per arm to detect 3.10% -> 3.30%: 118,987
Referral and organic customers are worth about 186 dollars against an acquisition cost of 15, a ratio above 12. Paid social customers are worth about 116 dollars against 60, and promotion-led customers about 70 against 40, ratios below 2. Software companies often use a rule of thumb that CLV should be at least three times CAC to leave room for overheads; consumer businesses use similar thresholds. By that test, two of Cedarline's three main acquisition routes barely pay for themselves, and the cheapest route, referrals, is the one Cedarline has invested in least. The cohort notes that the referral customers may also differ in who they are, not just in how they were acquired, so the comparison is not a causal estimate of what more referral spending would achieve.
Using CLV to manage customers
CLV supports several decisions. It sets a ceiling on what the firm should spend to acquire a customer from a given source. It identifies which customers are worth spending to retain, and when: a customer whose purchases are slowing may be worth a service call or a tailored offer, while one who buys only at deep discounts may not. It guides investment in service and loyalty programs by showing the value of a change in retention. And summed across customers, it gives customer equity, which can be compared with the firm's market value.
Grace's loyalty question can now be framed properly. The program is worth its 14 million dollars a year only if it raises the retention or spending of members above what they would have done without it. Comparing members with non-members cannot show this, because members were different to begin with. Fairway has three better options: compare the same households' behaviour before and after joining, against similar households that joined later; test changes to the program's rewards in randomly chosen stores or among randomly chosen members; or estimate the effect of the program's personalized offers by withholding them from a random holdout group. Fairway already has the data for the first and can run the third within a quarter.
Attribution
Customers usually encounter several marketing touchpoints before buying: an online video, a search, an email, a visit to a store. Attribution is the problem of assigning credit for a sale among them. The simplest rules are last-touch, which gives all credit to the final touchpoint before purchase, and first-touch, which gives it all to the first. Last-touch is still common because it is easy, but it systematically favours activation channels such as branded search and email that customers use when they have already decided, and starves the channels that created the demand. Linear, time-decay and position-based rules spread credit by fixed formulas.
A more principled approach borrows the Shapley value from cooperative game theory, proposed by Lloyd Shapley in 1953. Each channel's credit is its average marginal contribution to conversions, taken over all the orders in which the channels could be added. The second part of the code applies it to Cedarline's conversion data for three channels. Search, which last-touch credits with 60 per cent of conversions, receives about 49 per cent; paid social, credited with 10 per cent by last-touch, receives about 23 per cent, because journeys that include it convert much more often. Data-driven attribution models offered by advertising platforms use related ideas.
All attribution models share a limitation: they are built on observed journeys, so they measure association, not causation. A customer who sees many ads and then buys may have seen them because they were already interested. Attribution is therefore best used for tactical decisions within a channel, and combined with two other tools. Marketing mix models, statistical models of sales over time as a function of spending in each medium, prices, promotions, seasonality and other factors, with adstock and diminishing returns, estimate the contribution of each medium from aggregate data and need no tracking of individuals; several open-source versions released by large advertising platforms have made them more widely used. Experiments, such as the geographic holdout in lesson 9, provide the causal estimates that calibrate both. Analysts call the combination triangulation.
| Method | What it measures | Strengths | Weaknesses |
|---|---|---|---|
| Last-touch attribution | The final touchpoint before sale | Simple, available in every tool | Overcredits activation; ignores what created demand |
| Shapley or data-driven attribution | Average marginal contribution in observed journeys | Shares credit among channels | Correlational; needs tracking of individuals |
| Marketing mix modelling | Contribution of each medium from aggregate sales | Covers all media; no tracking needed | Needs long data series; many assumptions |
| Experiments and holdouts | Causal incremental effect | Unbiased if well designed | Narrow; cost of withholding marketing |
A/B testing in practice
The cohort learned the statistics of A/B testing in MBA-504. Dr. Lindqvist focuses on the decisions that make tests useful. A test should have a single primary metric chosen in advance, tied to value: contribution per visitor rather than clicks, as the cohort learned with the shipping threshold. It should have guardrail metrics that must not get worse, such as return rates or unsubscribe rates. Its sample size should be calculated in advance to detect the smallest effect worth acting on, and the test should run until that sample is reached, because stopping as soon as a result looks significant, peeking, inflates the rate of false positives. Novelty effects can make any change look good for a week or two, so tests that change customer experience should run long enough for them to fade.
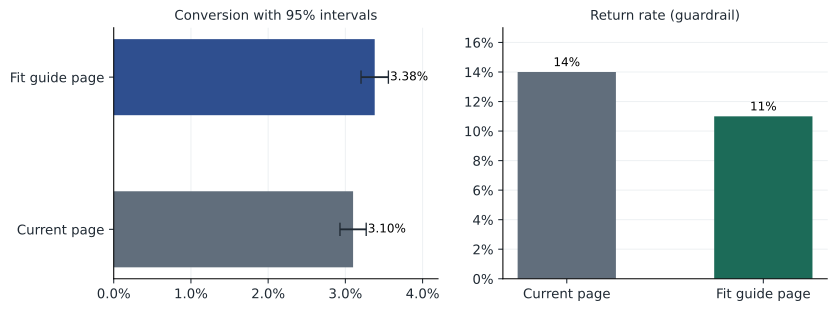
The third part of the code analyses a test of a new product page for Cedarline's jackets that adds a fit guide based on customers' height, weight and preferred fit. Conversion rose from 3.10 to 3.38 per cent among 40,000 visitors in each arm, a relative lift of about 9 per cent, with a p-value of about 0.025. The 95 per cent confidence interval for the difference runs from about 0.03 to 0.53 percentage points, so the effect is probably positive but could be small. The guardrail result matters even more: returns of jackets bought through the new page fell from 14 to 11 per cent, which, as lesson 8 showed, is worth several dollars an order. The last line shows that detecting a smaller lift, from 3.10 to 3.30 per cent, with 80 per cent power would need about 119,000 visitors per arm, which is why small online businesses often cannot test small changes reliably.
Worked problem
Kestrel's customer economics
Kestrel's growth tier for regional chains sells for an average of 54,000 dollars a year with a gross margin of 78 per cent after hosting and support. Annual retention is 88 per cent. Kestrel spends about 95,000 dollars in sales and marketing to win each new chain. Using a 12 per cent discount rate, what is the CLV, the CLV to CAC ratio and the payback period?
Show solution
- Annual margin m = 54,000 × 0.78 = 42,120 dollars.
- CLV = m / (1 + i - r) = 42,120 / (1.12 - 0.88) = 42,120 / 0.24, about 175,500 dollars.
- CLV / CAC = 175,500 / 95,000, about 1.8, below the common benchmark of 3.
- Payback, ignoring discounting: 95,000 / 42,120, about 2.3 years, against a typical target of 12 to 18 months for software sold to mid-sized firms.
Answer: The tier creates value but not by much, and it ties up cash for over two years per customer. Leo's levers are clear: shorter sales cycles from better targeting, as in lesson 4, would reduce CAC; higher retention, through faster onboarding, would raise CLV sharply, since each point of retention matters more as r approaches 1 + i. Raising retention from 88 to 92 per cent alone would raise CLV to about 210,600 dollars and the ratio to about 2.2.
Common mistakes
MistakeMembers of the loyalty program spend more, so the program works.
InsteadMembers self-select; measure the program's effect with before-and-after comparisons, staggered joins or randomized holdouts.
MistakeLast-touch attribution shows which channels drive sales.
InsteadIt overcredits activation channels; combine attribution with marketing mix models and experiments.
MistakeStop a test as soon as the result is significant.
InsteadPeeking inflates false positives; fix the sample size in advance.
MistakeA higher CLV means the customer is worth acquiring at any cost.
InsteadCompare CLV with acquisition cost and payback, and treat CLV as a forecast.
Summary and key terms
- Customer lifetime value is the present value of a customer's expected margins; with constant retention it equals m / (1 + i - r).
- Small improvements in retention have large effects on CLV and on firm value.
- Compare CLV with acquisition cost by source; promotion-acquired customers often have low CLV.
- Attribution rules share credit among touchpoints; Shapley values are principled but still correlational.
- Triangulate attribution, marketing mix models and experiments.
- Good A/B tests have a value-based primary metric, guardrails, a fixed sample size and enough duration to outlast novelty.
- Customer lifetime value
- The present value of the margins a customer is expected to generate over the relationship.
- Customer acquisition cost
- Marketing and sales spending required to acquire one new customer.
- Retention rate
- The probability that a customer remains active from one period to the next.
- Shapley value
- A method that credits each channel with its average marginal contribution across all orderings.
- Marketing mix model
- A statistical model of sales as a function of marketing spending and other drivers over time.
- Guardrail metric
- A metric that must not deteriorate in a test, alongside the primary metric.
Practice problems
Work each problem on paper first, then reveal the answer to check.
A customer generates 120 dollars of margin a year with 60 per cent retention and a 10 per cent discount rate. What is the CLV?
Show answer
120 / (1.10 - 0.60) = 240 dollars.
By how much does CLV rise if retention increases to 70 per cent?
Show answer
120 / 0.40 = 300 dollars, an increase of 25 per cent.
Why does last-touch attribution tend to overcredit branded search?
Show answer
Customers who have already decided search for the brand by name just before buying.
A test shows a significant lift on day three of a planned three-week test. What should the team do?
Show answer
Continue to the planned sample size; early results are prone to false positives and novelty effects.
Lesson quiz · 5 questions
Score 60% or more to complete this lesson.
Create a free account to save your progress, take quizzes and earn a certificate.