
JS-290 · Lesson 12 of 12 · 25 min
Demo day and retrospective
▶ Video coming soon A video version of this lesson is on the way.
Demo day is Thursday, May 31, 2029, at 2:00 p.m., in the Food Hub's community kitchen, because that is where most of the people who will use Rescue Runs can get to between their own shifts. Paul is there, with Lucy and Rosa. So are Wendy and two other drivers, the shift leads from Copperleaf Bakery and Pine Hill Grocers, Beatrix, and the whole of Brightwater: Rhea, Gareth, Theo and Sana. The team has twenty minutes to show what it built, and then twenty minutes for questions. The next morning, Friday, June 1, the team holds its project retrospective at the studio.
This last lesson is about finishing well: showing work in a way that helps the audience decide what to do next, looking honestly at what happened, and turning the lessons into changes. It is also the end of Mira's program, and the end of the story that started with a spreadsheet at the Riverside front desk in September 2026.
A demo is a story, not a tour
The first draft of the demo was a tour of screens: here is the donor screen, here is the driver screen, here is the coordinator screen. Gareth stopped the first rehearsal after four minutes. A tour shows that screens exist; it does not show that a problem is solved. The second draft is a story that follows one food rescue run from start to finish, in real time, on real phones, with the people who would really do each step. Copperleaf's shift lead posts an offer of bread and two trays of sandwiches at 2:04. Wendy, sitting in the second row, sees it appear on her phone within a minute and claims it, and the screen behind the team shows what she sees. Rosa records the delivery at the kitchen door at 2:11, with a temperature, and Lucy's screen shows the run go green. Then the team shows the same run going wrong, a driver without a cooler trying to claim the chilled sandwiches, and the app explaining why not.
Showing failure on purpose is a deliberate choice. The audience's real question is not whether the app works when everything goes right, but whether it protects them when something goes wrong. Rosa's reaction to the cooler message, a nod and *good*, says more about the project than any feature list.
Rehearsing and planning for failure
The team rehearses three times, twice at the studio and once in the kitchen itself on Tuesday, because the kitchen's Wi-Fi is the Wi-Fi the real demo will use. They write a run-of-show with a time for every step, and check that it fits with time to spare. And they prepare for the demo going wrong: a recording of the whole story made on Tuesday, mobile data on two phones in case the Wi-Fi fails, and seed data reset every morning so that nothing left over from rehearsals appears.
// Run-of-show for a 20-minute slot, with a buffer.
const slot = 20 * 60;
const steps = [
  ['Why: the spreadsheet and 37 missed pickups', 120],
  ['Copperleaf posts an offer', 90],
  ['Wendy sees and claims it', 90],
  ['Pickup, with no signal in the loading bay', 120],
  ['Rosa receives it, with the temperature', 90],
  ['Lucy sees the run complete; the month so far', 90],
  ['The cooler rule refuses a claim', 60],
  ['What the review found and fixed', 120],
  ['What starts on June 4, and what is next', 90],
];
let t = 0;
for (const [name, secs] of steps) {
  const start = `${Math.floor(t / 60)}:${String(t % 60).padStart(2, '0')}`;
  console.log(`${start.padStart(5)}  ${name}`);
  t += secs;
}
const spare = slot - t;
console.log(`total ${Math.floor(t / 60)} min ${t % 60} s, spare ${Math.floor(spare / 60)} min ${spare % 60} s`);
console.log(spare >= 0.1 * slot ? 'buffer is at least 10 in 100 of the slot' : 'cut something');0:00 Why: the spreadsheet and 37 missed pickups 2:00 Copperleaf posts an offer 3:30 Wendy sees and claims it 5:00 Pickup, with no signal in the loading bay 7:00 Rosa receives it, with the temperature 8:30 Lucy sees the run complete; the month so far 10:00 The cooler rule refuses a claim 11:00 What the review found and fixed 13:00 What starts on June 4, and what is next total 14 min 30 s, spare 5 min 30 s buffer is at least 10 in 100 of the slot
What this code does
Each step has a planned length in seconds, and the loop prints the minute and second at which each one starts. The total is compared with the twenty-minute slot, and the team's rule is that at least a tenth of the slot must be spare, because live demos always run long. The plan uses 14 minutes 30 seconds, leaving five and a half minutes for the unexpected.
The buffer turned out to be needed. Beatrix asked, during the receiving step, whether she could try it herself, and the team handed her the phone. Recording a delivery with her screen reader in front of forty people took her ninety seconds, and it was the moment of the afternoon people talked about afterwards.
What was planned and what was built
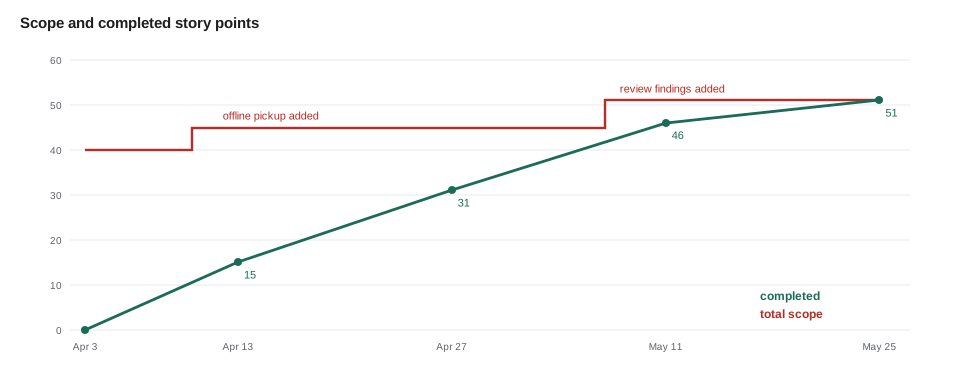
After the story, Mira spends two minutes on the numbers, because Paul will be asked about them by his board. She shows a burn-up chart: two lines over time, one for the total scope in story points and one for the points completed. The gap between them is the work left. The scope line rose twice, when offline pickup became a must-have and when the review's fixes were added, and the completed line meets it, just, on May 25.
// Planned and completed points per sprint, and how good the plans were.
const sprints = [
  { name: 'Sprint 1', planned: 18, done: 15 },
  { name: 'Sprint 2', planned: 16, done: 16 },
  { name: 'Sprint 3', planned: 16, done: 15 },
  { name: 'Hardening', planned: 6, done: 5 },
];
let total = 0;
for (const s of sprints) {
  total += s.done;
  const accuracy = Math.round((s.done / s.planned) * 100);
  console.log(`${s.name.padEnd(10)} planned ${String(s.planned).padStart(2)}, done ${String(s.done).padStart(2)}  (${accuracy} in 100 of plan)  total ${total}`);
}
const velocity = sprints.slice(0, 3).reduce((a, s) => a + s.done, 0) / 3;
console.log(`average velocity over the three sprints: ${velocity.toFixed(1)} points`);Sprint 1 planned 18, done 15 (83 in 100 of plan) total 15 Sprint 2 planned 16, done 16 (100 in 100 of plan) total 31 Sprint 3 planned 16, done 15 (94 in 100 of plan) total 46 Hardening planned 6, done 5 (83 in 100 of plan) total 51 average velocity over the three sprints: 15.3 points
What this code does
Each sprint's completed points are compared with its plan, giving a measure of how good the team's planning was, and a running total shows how the work added up. The first sprint finished 15 of 18 planned points, after which the team planned closer to its measured velocity. The average velocity of about 15 points a sprint is the number the next team on this code base should plan with.
The release contains all the must-haves, two of the three should-haves and one could-have. Sorting by distance from a start area, a should-have, made it in; the unclaimed-run alert for Lucy, the other should-have, is first on the list for June. The *Later* list still holds route planning and text messages, and now also donor history, shift swaps for drivers and a printable day sheet for the warehouse, which Rosa asked for during questions.
Answering questions honestly
Paul's first question is the one Rhea predicted: *Is it finished?* Mira's answer is the one Gareth coached: it is finished for the pilot, which means three donors and eight drivers from June 4, with Lucy's phone and spreadsheet still there as a fallback. It is not finished for all nine donors and twenty-two drivers until the pilot shows the measures moving, and the team will know that after three months. Overclaiming at a demo is tempting and expensive, because every promise made in the room becomes a deadline afterwards.
Other questions were practical. A driver asked what happens if her phone battery dies after she has claimed a run; the answer is that Lucy can see the claim and phone her, and that the run is released automatically if it is not picked up by the end of its window. Copperleaf's shift lead asked whether she could post from the shop's tablet rather than her own phone; she can, with a shop account, which Lucy will set up. And Rosa asked who to call if it breaks. The answer, written on a card for her, is Lucy during the day and the number in the runbook at night.
The retrospective
On Friday, June 1, the team holds a two-hour retrospective on the whole project, with Gareth facilitating so that Mira can take part as a team member. The rules are the ones every retrospective at Brightwater uses, often called the *prime directive* of retrospectives: everyone did the best job they could with what they knew at the time, so the conversation is about the system and the process, not about blaming people.
Gareth uses a timeline first. On a long sheet of paper, everyone adds sticky notes for events that mattered to them, above the line if they felt good and below if they did not: the matrix choosing food rescue, Wendy's ride-along, the token endpoint arriving late, the midnight bug, the photo metadata, Beatrix's session, launch day. Seeing the whole project at once reminds people of things they had forgotten, and shows patterns. Most notes below the line are in the first two weeks of Sprint 1.
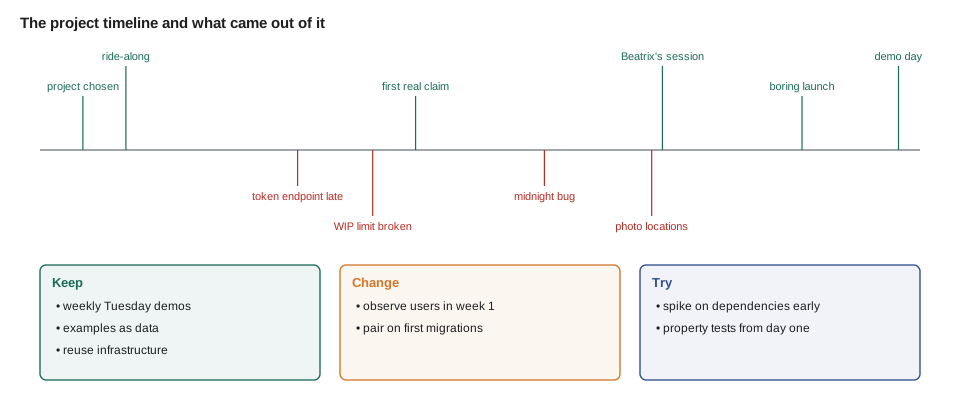
After the timeline, the team uses a simple format: *keep*, *change* and *try*. Each person writes notes silently for ten minutes, then reads them out, and similar notes are grouped. Then everyone gets three votes, dot voting, to choose the groups that matter most, because a retrospective that tries to fix everything fixes nothing.
// Dot voting: three votes each, then the top groups become actions.
const votes = {
  Mira: ['earlier spikes on dependencies', 'pair on first migrations', 'observe users in week 1'],
  Odalys: ['observe users in week 1', 'property tests from the start', 'earlier spikes on dependencies'],
  Tavish: ['pair on first migrations', 'earlier spikes on dependencies', 'property tests from the start'],
  Gareth: ['earlier spikes on dependencies', 'smaller pull requests', 'observe users in week 1'],
};
const tally = {};
for (const list of Object.values(votes)) for (const g of list) tally[g] = (tally[g] ?? 0) + 1;

const ranked = Object.entries(tally).sort((a, b) => b[1] - a[1] || a[0].localeCompare(b[0]));
ranked.forEach(([g, n]) => console.log(`${'*'.repeat(n).padEnd(5)} ${g}`));
console.log('actions:', ranked.slice(0, 3).map(([g]) => g).join('; '));**** earlier spikes on dependencies *** observe users in week 1 ** pair on first migrations ** property tests from the start * smaller pull requests actions: earlier spikes on dependencies; observe users in week 1; pair on first migrations
What this code does
Every person's three votes are added up per group, and the groups are sorted by votes with ties broken alphabetically, so the order is always the same. The stars give the at-a-glance picture a wall of sticky notes gives in the room. The top three groups become the retrospective's actions, each of which gets an owner before anyone leaves.
| Action | Owner | What changes |
|---|---|---|
| Spike on outside dependencies in the first week | Mira, for the studio's project template | Any piece another person must build, such as the token endpoint, gets a one-day spike and a date before Sprint 1 |
| Observe users in the first week, not the second | Odalys | The discovery checklist puts ride-alongs and site visits before interviews are written up |
| Pair on the first migration of any new schema | Tavish, with Theo | The CODEOWNERS review becomes a pairing session for first migrations |
The *keep* column is just as important, and the team spends time on it. Keep the weekly Tuesday demos, which caught the alphabetical category list and the misplaced pickup button long before launch. Keep writing acceptance examples as data. Keep the Definition of Done, including staging and accessibility. Keep reusing the studio's infrastructure, which made launch day boring. And keep inviting users like Beatrix and Wendy as experts, paid for their time, rather than as people to test on at the end.
Measuring after the course
The project's success measures from lesson 1 cannot be judged on demo day, because the pilot has not started. The team leaves Lucy with a short script that turns the app's data into the same measures, missed pickups, runs covered at short notice and chilled runs without a cooler, each in every 100 runs, so that the comparison with the 2028 spreadsheet is made the same way every month. Lucy will keep counting her phone calls by hand. Mira puts a meeting in the calendar for Tuesday, September 4, 2029, three months into the pilot, to look at the numbers with Lucy and decide whether to widen the pilot to all nine donors.
// The measures from lesson 1, computed the same way every month.
function measures(runs) {
  const per100 = (n) => Math.round((n / runs.length) * 1000) / 10;
  return {
    missed: per100(runs.filter((r) => r.status === 'missed' || r.status === 'unclaimed').length),
    shortNotice: per100(runs.filter((r) => r.claimedMinutesBefore !== null && r.claimedMinutesBefore < 120).length),
    chilledNoCooler: per100(runs.filter((r) => r.chilled && r.cooler === false).length),
  };
}

// Invented example month: 200 runs.
const runs = Array.from({ length: 200 }, (_, i) => ({
  status: i < 3 ? 'unclaimed' : i < 4 ? 'missed' : 'received',
  claimedMinutesBefore: i < 4 ? null : i < 12 ? 90 : 300,
  chilled: i % 5 === 0,
  cooler: true,
}));
console.log('2028 baseline: missed 2.5, short notice 7.6, chilled without cooler 0.6 (in 100 runs)');
console.log('example month:', measures(runs));2028 baseline: missed 2.5, short notice 7.6, chilled without cooler 0.6 (in 100 runs)
example month: { missed: 2, shortNotice: 4, chilledNoCooler: 0 }What this code does
The function computes each measure as a count in every 100 runs, rounded to one decimal place, exactly as lesson 1 did for the spreadsheet baseline. Offers nobody claimed count as missed pickups along with runs marked missed, which is the definition Lucy and Mira agreed in lesson 6. The example month is invented to show the output; the real comparison waits for the pilot's data.
The end of the program
At the end of the retrospective, Gareth asks Mira to look back further than the project. In September 2026 she arrived at Brightwater from the Riverside front desk, where she had run the volunteer schedule in spreadsheets for four years. Her first commit was a heading on the Food Hub's rebuilt home page. Since then she has written the lunch counter calculator, the volunteer portal, the partner order service, the kitchen board, the deployment pipeline and, with Odalys and Tavish, Rescue Runs. More importantly, she has learned to ask who has the problem before deciding what to build, to write down decisions, to test what matters, to ship small and often, and to leave things so that someone else can look after them.
Lucy says something similar from the other side. Three years ago the Food Hub had a 2014 template website, a PDF volunteer form and a spreadsheet. Now it has software that works for its volunteers, its partners, its kitchen and its donors, built by people who came to see how the work is actually done. On Monday, June 4, at 3:30 in the afternoon, Copperleaf Bakery posts the first real offer of the pilot: 14 kg of bread and rolls, collected by Wendy at 5:15. Lucy does not have to make a single phone call about it.
Worked problem
Reading the burn-up chart
At the start of Sprint 1 the scope was 40 points. Offline pickup (5 points) was added in Sprint 1 and the review findings (6 points) in Sprint 3; Sprint 2 also moved monthly totals (3 points) down to should-have, but it stayed in the release. The team completed 15, 16, 15 and 5 points in the four periods. What was the final scope, how many points were completed, and was everything finished?
Show solution
- Final scope: 40 + 5 + 6 = 51 points; moving monthly totals between priorities does not change the scope, because it stayed in the release.
- Completed: 15 + 16 + 15 + 5 = 51 points.
- Remaining: 51 − 51 = 0.
- The lines meet at the end of hardening, on May 25.
Answer: The final scope was 51 points and all 51 were completed by May 25. The burn-up chart makes the two scope increases visible, which is why Paul could see that the team finished on time despite the plan growing by more than a quarter.
Common mistakes
MistakeDemonstrating a tour of screens.
InsteadTell the story of one real task from start to finish, with the people who do it.
MistakeShowing only the happy path.
InsteadShow how the app behaves when something goes wrong, because that is what users worry about.
MistakePromising more at the demo than the plan supports.
InsteadSay clearly what is finished, for whom, and what will be decided later.
MistakeRunning a retrospective that blames people.
InsteadTalk about the system and the process, and assume everyone did their best with what they knew.
MistakeLeaving a retrospective with a long list and no owners.
InsteadDot-vote, choose a few actions, and give each one an owner and a visible change.
Summary and key terms
- A demo tells the story of a real task from start to finish, with the people who do it, and shows how the app handles failure.
- Rehearsals in the real setting, a timed run-of-show with a buffer, a recording and fresh seed data prepare for things going wrong.
- A burn-up chart shows scope and completed work over time, including scope changes, and comparing planned with completed points shows how good the plans were.
- Questions are answered honestly about what is finished and for whom.
- A retrospective assumes good intent, uses a timeline to recall the whole project, gathers keep, change and try notes, and dot-votes a few actions with owners.
- Success measures are computed the same way every month after the course, and the decision to widen the pilot waits for the data.
- Demo
- A live showing of working software to the people who will use or pay for it.
- Run-of-show
- A timed plan of every step in a demo or presentation.
- Burn-up chart
- A chart of total scope and completed work over time.
- Retrospective
- A meeting in which a team reflects on how it worked and agrees changes.
- Prime directive
- The retrospective principle that everyone did the best job they could with what they knew at the time.
- Dot voting
- Giving each person a few votes to choose which topics matter most.
- Action item
- A specific change agreed in a retrospective, with an owner.
Practice problems
Work each problem on paper first, then reveal the answer to check.
Why did the team demonstrate one run from start to finish instead of each screen?
Show answer
A story shows that the problem is solved; a tour only shows that screens exist.
Why did the team show the cooler rule refusing a claim?
Show answer
Users care most about how the app protects them when something goes wrong.
What does a burn-up chart show that a burn-down chart can hide?
Show answer
Changes in total scope, as a separate line.
Why does dot voting limit each person to three votes?
Show answer
So the team chooses a few changes it can actually make.
Try it yourself
Dot vote tally
Complete topGroups(votes, n). votes maps each person to a list of group names they voted for.
Return the n groups with the most votes, most first; break ties alphabetically.
function topGroups(votes, n) {
  return [];
}

const votes = {
  A: ['spikes', 'pairing', 'observe'],
  B: ['observe', 'tests', 'spikes'],
  C: ['pairing', 'spikes', 'tests'],
};
console.log(topGroups(votes, 2).join(', '));
console.log(topGroups(votes, 4).join(', '));
Try it yourself
Plan accuracy
Complete accuracy(sprints). Each sprint is { planned, done }.
Return a list of strings, one per sprint, of the completed points as a whole number in each 100 planned, followed by in 100. Then a final string total D of P with the sums.
function accuracy(sprints) {
  return [];
}

console.log(accuracy([{ planned: 18, done: 15 }, { planned: 16, done: 16 }, { planned: 16, done: 15 }]).join('\n'));
Lesson quiz · 5 questions
Score 60% or more to complete this lesson.
Create a free account to save your progress, take quizzes and earn a certificate.