
ENGG-401 · Lesson 7 of 12 · 28 min
Incremental analysis and mutually exclusive alternatives
When an engineer must choose one design from several that meet the same need, the obvious approach of picking the alternative with the highest rate of return is often wrong. A small project can have a spectacular rate of return but add little value, while a larger alternative earns a lower rate on its total investment yet adds more value because the extra money it requires also earns more than the MARR. Incremental analysis resolves this by asking, step by step, whether each additional dollar of investment is justified. This lesson explains why ranking by rate of return fails, the incremental rate of return procedure, its agreement with present worth, Fisher's intersection, handling cost-only alternatives, unequal lives, independent projects under a budget limit, and practical guidance on choosing a method.
Why ranking by IRR fails
Consider three mutually exclusive process improvements, each lasting 8 years with no salvage value, evaluated at a MARR of 12 %:
| Alternative | First cost | Annual net benefit | IRR | PW at 12 % |
|---|---|---|---|---|
| A | $100,000 | $26,000 | 19.9 % | $29,159 |
| B | $150,000 | $37,500 | 18.6 % | $36,286 |
| C | $220,000 | $49,000 | 15.0 % | $23,414 |
All three have rates of return above the MARR, and A has the highest. But B has the highest present worth: it adds about $7,100 more value than A. The reason is that B's extra investment of $50,000 over A brings extra benefits of $11,500 a year, a return of about 16 % on the increment, comfortably above the 12 % MARR. Choosing A because of its higher IRR would leave money on the table. The IRR of each alternative measures the return on its total investment, but the decision depends on whether each increment of investment earns the MARR.
The incremental rate of return procedure
Incremental analysis compares alternatives in pairs, always asking whether the more expensive one justifies its additional cost:
- 1. List the alternatives in order of increasing first cost, including the do-nothing alternative if feasible.
- 2. Take the least expensive acceptable alternative as the current best (the defender). If do-nothing is feasible, check that the cheapest alternative has an IRR above the MARR; otherwise do-nothing is the defender.
- 3. Compute the incremental cash flows of the next alternative (the challenger) minus the defender.
- 4. Find the incremental rate of return \(\Delta i^*\) on those cash flows.
- 5. If \(\Delta i^* \ge \text{MARR}\), the challenger becomes the new defender; otherwise, the defender remains.
- 6. Repeat with the next more expensive alternative until all have been considered. The final defender is the best choice.
Worked problem
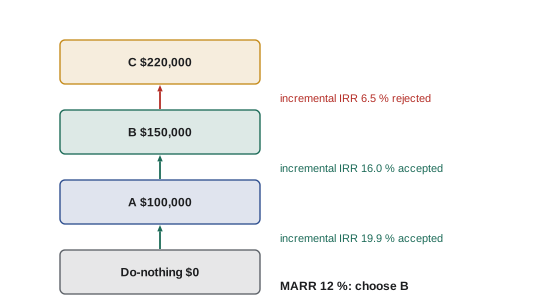
Incremental analysis of A, B and C
Apply the incremental procedure to the three alternatives above at a MARR of 12 %.
Show solution
- Order: do-nothing, A ($100,000), B ($150,000), C ($220,000).
- A vs do-nothing: \(i^*_A = 19.9\,\% > 12\,\%\), so A becomes the defender.
- B − A: −$50,000 at year 0, +$11,500 per year for 8 years; \(\Delta i^* = 16.0\,\% > 12\,\%\), so B becomes the defender.
- C − B: −$70,000 at year 0, +$11,500 per year; \(\Delta i^* = 6.5\,\% < 12\,\%\), so B remains the defender.
Answer: Choose B, the same choice as the highest present worth.
Agreement with present worth
Incremental rate of return analysis and present worth analysis always select the same alternative, provided the incremental cash flows have unique rates of return and the same study period is used. The reason is that the present worth of the increment \(B - A\) is simply \(PW_B - PW_A\): if the increment earns more than the MARR, its present worth is positive and B has the higher present worth. Present worth reaches the answer in one step, choosing the highest value, while incremental IRR requires a sequence of comparisons. Many analysts therefore use present worth for the decision and report the incremental IRRs to show that each step is justified.
Fisher's intersection
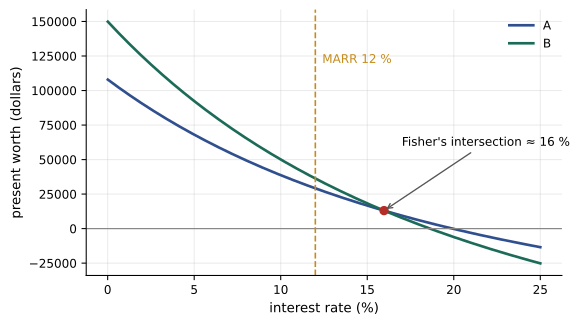
Plotting the present worth profiles of two alternatives on the same axes reveals where they cross. The interest rate at the crossing, called Fisher's intersection, is exactly the incremental rate of return of the pair. For A and B, the curves cross at about 16 %: at interest rates below 16 %, B has the higher present worth; above 16 %, A does. This shows why the choice can change with the MARR. Alternatives with large first costs and long-lasting benefits are favoured at low discount rates, while cheaper alternatives with quicker returns are favoured at high rates. Fisher's intersection is a useful way to explain to decision-makers how sensitive a choice is to the MARR.
Cost-only alternatives
Many engineering choices involve alternatives that provide the same service at different costs, with no separate revenue, such as two pumps, two roof systems or two lighting designs. Incremental analysis still applies: the more expensive alternative is justified if its savings in operating costs earn at least the MARR on the extra first cost. The incremental cash flow is the extra first cost (negative) followed by the annual savings (positive). For example, if a premium-efficiency motor costs $4,000 more than a standard motor and saves $900 a year in electricity over 10 years, its incremental rate of return is about 18.3 %, so it is justified at a MARR of 12 %. With cost-only alternatives, do-nothing is usually not feasible, since the service is required, so the analysis starts from the cheapest alternative.
Unequal lives
Incremental analysis of alternatives with unequal lives must use a common period, either the least common multiple with repeated cash flows or a study period with market values, just as present worth does. An alternative way is to set the difference in annual worths equal to zero and solve for the interest rate, which is valid under the repeatability assumption because annual worths are the same in each cycle. Comparing the IRR of each alternative over its own life is not valid.
Independent projects and capital budgeting
Independent projects can each be accepted or rejected, but firms rarely have unlimited capital. Capital budgeting allocates a limited budget among independent projects to maximize total value. With no budget limit, accept every project with \(PW \ge 0\). With a budget limit, choose the combination of projects that fits within the budget and has the largest total present worth. For small numbers of projects, this can be done by listing all feasible combinations, called mutually exclusive bundles, and choosing the bundle with the highest present worth. For larger problems, ranking by the profitability index, the ratio of present worth of future cash flows to the investment, gives a good approximation, and integer programming gives exact answers.
Worked problem
Choosing projects under a budget
A plant has $300,000 to invest. Independent projects are: P1 costing $100,000 with PW $29,000; P2 costing $150,000 with PW $36,000; P3 costing $120,000 with PW $30,000; P4 costing $80,000 with PW $12,000. Which combination maximizes present worth within the budget?
Show solution
- List bundles within $300,000: for example P1 + P2 ($250,000, PW $65,000); P1 + P3 + P4 ($300,000, PW $71,000); P2 + P3 ($270,000, PW $66,000); P2 + P4 ($230,000, PW $48,000).
- P1 + P3 + P4 uses the full budget and has the highest total PW.
- Profitability indexes: P1 1.29, P3 1.25, P2 1.24, P4 1.15; ranking by PI and filling the budget gives P1, P3, then P4 (P2 no longer fits), the same answer here.
Answer: Fund P1, P3 and P4 for a total present worth of $71,000.
Choosing a method
All correctly applied methods lead to the same decision for mutually exclusive alternatives, but they differ in convenience:
- Present worth: one calculation per alternative, direct measure of value, ideal for decisions.
- Annual worth: convenient for unequal lives and budget presentations.
- Incremental IRR: communicates returns on each step; requires care with multiple roots and many comparisons.
- Incremental benefit-cost ratio: standard for public projects (Lesson 8).
The most common errors in practice are choosing by the highest IRR or benefit-cost ratio of each alternative rather than by increments, comparing alternatives over different periods, and ignoring the do-nothing alternative. A disciplined approach, ordering alternatives, drawing incremental cash flow diagrams and checking results with present worth, avoids them.
Incremental analysis with many alternatives
When there are many mutually exclusive alternatives, incremental analysis can be organized efficiently. After ordering by first cost, each challenger is compared only with the current defender, not with every other alternative. Alternatives that are dominated, costing more but offering lower benefits than another alternative, can be eliminated before the analysis. For cost-only alternatives, a useful check is that annual savings must increase with first cost; if a more expensive alternative has higher operating costs too, it can be discarded immediately. Spreadsheets make it easy to compute present worth for all alternatives at once, choose the highest, and then confirm with the incremental IRRs along the chosen path.
Contingent and dependent projects
Some projects depend on others: a new production line may require a power upgrade, or a software system may require new servers. Contingent projects can only be undertaken if the project they depend on is also undertaken. In capital budgeting, the dependent pair is treated as a single bundle, with combined cash flows, and the independent project on its own is a separate bundle. Mutually exclusive bundles must respect these dependencies, so that infeasible combinations are excluded before the bundle with the highest present worth is chosen.
Worked problem
Dominated alternatives
Four roofing systems have first costs of $80,000, $95,000, $110,000 and $120,000 and annual maintenance costs of $6,000, $4,500, $5,000 and $2,500 respectively, all with 20-year lives. Which can be eliminated before incremental analysis?
Show solution
- The $110,000 system costs more than the $95,000 system and has higher annual costs.
- It is dominated and can be removed.
- Incremental analysis then compares $80,000, $95,000 and $120,000 in order.
Answer: The $110,000 system is dominated and can be eliminated.
Incremental analysis in design optimization
Many engineering design problems involve choosing a size or level of investment from a continuous range, such as pipe diameter, insulation thickness, transformer size or the capacity of a solar installation. Each step up in size costs more and saves more in operating costs, with diminishing returns. The economic optimum is the size at which the incremental rate of return on the last step falls to the MARR, which is also the size that minimizes total EUAC. Plotting capital recovery and operating costs against size shows the familiar U-shaped total cost curve, whose minimum identifies the optimum.
Incremental analysis and the do-nothing alternative
When do-nothing is feasible, it is always the first defender, and the cheapest alternative must justify its entire investment. When do-nothing is not feasible, because a service must be provided, the cheapest alternative is the starting defender even if its own return is below the MARR, and only increments above it are tested. Stating clearly whether do-nothing is feasible avoids the common error of rejecting all alternatives when one must be chosen.
Documenting each incremental comparison in a short table, listing the defender, the challenger, the incremental cash flows, the incremental rate and the decision, makes the reasoning easy for others to follow and review.
Common mistakes
MistakeChoosing the alternative with the highest IRR.
InsteadUse incremental IRR or highest PW.
MistakeComparing increments without ordering by first cost.
InsteadOrder alternatives by increasing investment.
MistakeSkipping the do-nothing check.
InsteadConfirm the first alternative beats doing nothing when feasible.
MistakeUsing different periods in incremental analysis.
InsteadUse a common LCM or study period.
MistakeRanking budget projects by PW alone.
InsteadMaximize total PW within the budget, using bundles or PI.
Summary and key terms
- The IRR of each alternative measures return on total investment, not on increments.
- Incremental analysis tests whether each extra investment earns the MARR.
- Order alternatives by first cost and compare challenger with defender.
- Incremental IRR and present worth select the same alternative.
- Fisher's intersection is the incremental IRR where PW profiles cross.
- Cost-only alternatives use extra first cost against savings.
- Under budget limits, maximize total PW using bundles or the profitability index.
- Incremental analysis
- Evaluating the difference between alternatives.
- Defender
- Current best alternative in incremental analysis.
- Challenger
- Next alternative tested against the defender.
- Incremental IRR
- Rate of return on incremental cash flows.
- Fisher's intersection
- Rate where two PW profiles cross.
- Cost-only alternatives
- Alternatives differing only in costs.
- Capital budgeting
- Allocating limited capital among projects.
- Mutually exclusive bundle
- A feasible combination of independent projects.
- Profitability index
- Ratio of PW of future cash flows to investment.
- Capital rationing
- Limiting the funds available for investment.
Practice problems
Work each problem on paper first, then reveal the answer to check.
Why can the highest IRR alternative be the wrong choice?
Show answer
Extra investment in a larger alternative may also earn above the MARR.
First step of incremental analysis?
Show answer
Order alternatives by increasing first cost.
When does the challenger become the defender?
Show answer
When incremental IRR ≥ MARR.
In the example, why is C rejected?
Show answer
Its increment over B earns only 6.5 %.
What is Fisher's intersection?
Show answer
The rate where two PW profiles cross, the incremental IRR.
Is a $4,000 extra cost saving $900 a year for 10 years justified at 12 %?
Show answer
Yes, incremental IRR about 18 %.
Do PW and incremental IRR agree?
Show answer
Yes, with a common period and unique roots.
What is a mutually exclusive bundle?
Show answer
A feasible combination of independent projects.
PI of a project costing $50,000 with future PW of $65,000?
Show answer
1.3.
How should unequal lives be handled incrementally?
Show answer
Common LCM or study period, or AW difference equal to zero.
Lesson quiz · 5 questions
Score 60% or more to complete this lesson.
Create a free account to save your progress, take quizzes and earn a certificate.