
DCE-460 · Lesson 7 of 12 · 24 min
Carbon accounting for data centres
Customers, investors and regulators increasingly ask data centre operators a simple question: how much greenhouse gas does your facility emit, and what are you doing about it? Answering it credibly requires a carbon inventory built according to recognized rules, which define what is counted, how electricity emissions are calculated, and how clean energy purchases may be reflected. The rules are more subtle than they first appear, and the same facility can report very different numbers depending on the method. This lesson explains the Greenhouse Gas Protocol's scopes, the sources of emissions in a data centre, the two methods for Scope 2 electricity emissions, emission factors, Scope 3 including embodied carbon, and the principles that make carbon accounting credible.
The Greenhouse Gas Protocol and its scopes
The Greenhouse Gas Protocol, developed by the World Resources Institute and the World Business Council for Sustainable Development, is the most widely used standard for corporate emissions accounting, and it underlies most regulatory reporting schemes. It divides an organization's emissions into three scopes:
- Scope 1: direct emissions from sources the organization owns or controls, such as fuel burned in generators and boilers, and leaks of refrigerants and fire suppression gases.
- Scope 2: indirect emissions from the generation of purchased electricity, heat, steam and cooling consumed by the organization.
- Scope 3: all other indirect emissions in the value chain, upstream (such as purchased goods, capital goods including construction and IT hardware, transport, and the upstream emissions of fuels) and downstream (such as the use and end-of-life of products sold).
Emissions are expressed in tonnes of carbon dioxide equivalent (CO₂e), converting other gases using their global warming potentials (GWP). The Protocol is being revised, with updates to the Scope 2 guidance under discussion that could tighten the rules for clean energy claims, including moves toward hourly matching (Lesson 8).
Where data centre emissions come from
For most data centres, Scope 2 electricity emissions dominate the operational inventory. Scope 1 is usually small but not negligible: diesel burned during generator testing and outages, and refrigerant leaks, which can be surprisingly significant because many refrigerants have GWPs over a thousand. Scope 3 includes the embodied emissions of the building and the IT hardware, which become relatively more important as operational emissions fall.
For a colocation provider, the electricity used by customers' IT equipment is often counted in the provider's Scope 2 (because the provider buys the electricity), and in the customers' Scope 3 (or Scope 2, depending on contractual arrangements and how the customer applies the Protocol). Clear agreements on how emissions and clean energy attributes are allocated between provider and customers avoid double counting.
# Annual greenhouse gas inventory for a 20 MW (IT) facility, in t CO2e
facility_MWh = 20 * 8760 * 0.8 * 1.3                     # average 80 % load, PUE 1.3

# Scope 1: generator testing and refrigerant leakage
diesel_L = 60000                                          # monthly tests and annual load bank runs
scope1_diesel = diesel_L * 2.68 / 1000
leak_kg, gwp = 150, 1430                                  # R-134a, 100-year GWP (IPCC AR4 value, widely used)
scope1_refrig = leak_kg * gwp / 1000
scope1 = scope1_diesel + scope1_refrig

# Scope 2: location-based uses the grid average; market-based uses contracts and the residual mix
grid_g = 380                                              # grid average, g CO2e per kWh
residual_g = 450                                          # residual mix after others claim their clean energy
contracted_MWh = 0.70 * facility_MWh                      # matched by a qualifying renewable PPA
scope2_loc = facility_MWh * grid_g / 1000
scope2_mkt = (facility_MWh - contracted_MWh) * residual_g / 1000

# Scope 3 (partial): embodied emissions of servers, amortized over their life
servers, kg_per_server, life_years = 9000, 1300, 5
scope3_it = servers * kg_per_server / life_years / 1000

print(f"Facility energy: {facility_MWh:,.0f} MWh")
print(f"Scope 1: diesel {scope1_diesel:,.0f} t + refrigerant {scope1_refrig:,.0f} t = {scope1:,.0f} t")
print(f"Scope 2 location-based: {scope2_loc:,.0f} t")
print(f"Scope 2 market-based (70 % PPA, residual mix for the rest): {scope2_mkt:,.0f} t")
print(f"Scope 3, server embodied carbon per year: {scope3_it:,.0f} t")Facility energy: 182,208 MWh Scope 1: diesel 161 t + refrigerant 214 t = 375 t Scope 2 location-based: 69,239 t Scope 2 market-based (70 % PPA, residual mix for the rest): 24,598 t Scope 3, server embodied carbon per year: 2,340 t
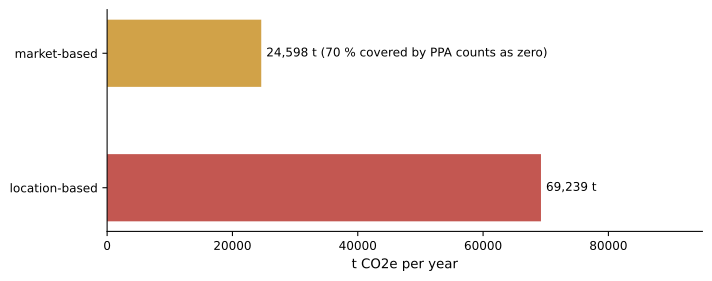
In this inventory, Scope 1 totals a few hundred tonnes, more than half of it from refrigerant leakage. Location-based Scope 2 is about 69,000 t, two hundred times larger. A renewable power purchase agreement covering 70 % of consumption reduces market-based Scope 2 to about 25,000 t. The embodied carbon of servers, spread over their five-year life, adds over 2,000 t a year, small compared with location-based Scope 2 on this grid but significant compared with market-based emissions or with Scope 2 on a clean grid.
Location-based and market-based Scope 2
The Protocol's Scope 2 Guidance requires organizations to report electricity emissions in two ways:
- Location-based: consumption multiplied by the average emission factor of the grid where the electricity is used. It reflects the physical emissions of the local grid and cannot be changed by purchasing decisions, only by using less electricity or by the grid becoming cleaner.
- Market-based: consumption multiplied by emission factors derived from the contractual instruments the organization holds, such as power purchase agreements (PPAs), utility green tariffs and energy attribute certificates (renewable energy certificates, RECs, in North America). Consumption not covered by instruments uses the residual mix factor: the grid average with the claimed clean energy removed, which is higher than the grid average.
Market-based accounting lets organizations reflect clean energy purchases, which has driven large investments in renewable energy. But it has been criticized because instruments can be bought from distant regions or different times than the consumption they cover, so that a facility running on a coal-heavy grid at night can claim zero emissions with certificates from solar farms elsewhere. Quality criteria in the Scope 2 Guidance and in schemes such as RE100 aim to limit this, and hourly matching (Lesson 8) addresses it more directly.
Emission factors
Location-based factors come from official sources for each grid region, and they differ enormously between regions, from a few grams per kilowatt-hour in hydro and nuclear regions to several hundred in fossil-dominated ones.
In Canada, grid emission factors are published by province in Environment and Climate Change Canada's National Inventory Report. They range from near zero in Quebec, Manitoba and British Columbia (largely hydroelectric), through low values in Ontario (nuclear and hydro, with some natural gas), to several hundred grams per kilowatt-hour in Alberta, Saskatchewan and Nova Scotia, where natural gas and coal remain significant.
Average factors describe the typical emissions of the grid; marginal factors describe the emissions of the generator that responds to a change in load, which is often a fossil plant even on a fairly clean grid. Marginal factors are useful for assessing the effect of new loads or load shifting (Lesson 8), but inventories use average factors.
Scope 3 and embodied carbon
Scope 3 is the hardest category to measure, because it relies on data from suppliers and on estimates. For data centres, the most important Scope 3 categories are usually capital goods (the embodied carbon of construction materials, mechanical and electrical equipment, and IT hardware) and purchased goods and services. Embodied carbon is estimated from life cycle assessments of products, environmental product declarations (EPDs) for construction materials, and supplier data, often supplemented by spend-based estimates. As data centres decarbonize their electricity, embodied carbon becomes a larger share of their footprint, which is the subject of Lesson 10.
Principles of credible accounting
The Protocol sets out five principles: relevance (the inventory reflects the organization's real emissions and serves decision-makers), completeness (all sources within the boundary are included, and exclusions disclosed), consistency (methods are consistent over time, so trends are meaningful), transparency (assumptions, methods and data sources are disclosed) and accuracy (systematic over- or under-statement is avoided and uncertainty is reduced). In practice, credible data centre reporting discloses both Scope 2 methods, the instruments used and their characteristics (location, vintage, type), the refrigerants and leakage, the boundary between provider and customers, and the basis for Scope 3 estimates. Third-party verification is increasingly expected and, under some regulations, required (Lesson 11).
Worked problem
Reporting for a colocation customer
A customer uses 2,000 MWh a year of IT energy in a colocation facility with annual PUE 1.35, on a grid with a location-based factor of 400 g/kWh. The provider buys RECs from the same grid region covering 100 % of its consumption. What emissions should the customer consider for its reporting?
Show solution
- The customer's share of facility energy: 2,000 × 1.35 = 2,700 MWh.
- Location-based: 2,700 × 400 / 1,000 = 1,080 t CO₂e.
- Market-based: if the provider's contract allocates the RECs to customers' consumption and the instruments meet the Scope 2 quality criteria, the customer may report 0 t for this consumption; otherwise it uses the residual mix.
Answer: The customer should report about 1,080 t location-based and, with properly allocated and qualifying RECs, near zero market-based, disclosing both. It should ask the provider for documentation of the instruments and their allocation, and recognize that unbundled RECs do little to change the grid's physical emissions, which is why many organizations now prefer PPAs and hourly matching.
Setting the organizational boundary
Before calculating anything, an organization must decide which operations its inventory covers. The Protocol offers three approaches: equity share (emissions in proportion to ownership), financial control and operational control. Data centre companies typically use operational control, including facilities they operate whether owned or leased. Leased facilities, joint ventures and sites operated by third parties need careful treatment so that emissions are neither omitted nor counted twice. The boundary, the base year against which progress is measured, and any recalculations of the base year after acquisitions or methodology changes must be documented and disclosed.
Data quality
The accuracy of an inventory depends on its activity data (metered electricity, fuel delivered, refrigerant purchased) and its emission factors. Metered data are best; estimates based on design capacity or spending carry much greater uncertainty. Refrigerant leaks are often estimated from the quantity of refrigerant added during maintenance, which requires good records from service contractors. A data quality assessment that rates each source and identifies improvements is a standard part of mature carbon accounting.
Carbon accounting is not an end in itself. Its purpose is to show where emissions arise, so that the measures in the rest of this course can be targeted where they matter most, and to track whether those measures are working.
Common mistakes
MistakeReporting only market-based Scope 2.
InsteadReport both location-based and market-based figures.
MistakeUsing the grid average for uncovered market-based consumption.
InsteadUse the residual mix factor where available.
MistakeIgnoring refrigerant leaks.
InsteadTrack refrigerant purchases and leaks and include them in Scope 1.
MistakeLeaving provider and customer allocation unclear.
InsteadAgree contractually on how emissions and certificates are allocated.
MistakeOmitting embodied carbon.
InsteadEstimate Scope 3 capital goods, which grow in relative importance.
Summary and key terms
- The GHG Protocol divides emissions into Scope 1 (direct), Scope 2 (purchased energy) and Scope 3 (value chain).
- Scope 2 electricity dominates most data centre operational inventories.
- Scope 1 includes generator diesel and refrigerant leaks, which can be significant.
- Location-based Scope 2 uses grid averages; market-based uses contracts and the residual mix.
- Grid factors vary enormously by region; marginal factors differ from averages.
- Embodied carbon in Scope 3 grows in importance as electricity decarbonizes.
- Credible reporting is relevant, complete, consistent, transparent and accurate, and increasingly verified.
- GHG Protocol
- The main international standard for corporate emissions accounting.
- CO₂e
- Carbon dioxide equivalent, using global warming potentials.
- Scope 1
- Direct emissions from owned or controlled sources.
- Scope 2
- Emissions from purchased electricity, heat, steam and cooling.
- Scope 3
- Other indirect value-chain emissions.
- Location-based method
- Scope 2 using average grid emission factors.
- Market-based method
- Scope 2 using contractual instruments and the residual mix.
- REC
- Renewable energy certificate representing 1 MWh of renewable generation.
- Residual mix
- Grid emissions after claimed clean energy is removed.
- Marginal emission factor
- Emissions of the generation that responds to a change in load.
Practice problems
Work each problem on paper first, then reveal the answer to check.
Which scope covers generator diesel?
Show answer
Scope 1.
Which scope covers purchased electricity?
Show answer
Scope 2.
How many tonnes of CO₂e does a 50 kg leak of a refrigerant with GWP 2,000 cause?
Show answer
100 t.
From the output, what share of Scope 1 comes from refrigerant?
Show answer
About 57 % (214 of 375 t).
What is the location-based Scope 2 for 10,000 MWh on a 250 g/kWh grid?
Show answer
2,500 t.
Why is the residual mix higher than the grid average?
Show answer
Clean energy claimed by others is removed from it.
What is a criticism of market-based accounting?
Show answer
Instruments can come from other places and times, so claims may not reflect physical emissions.
When are marginal emission factors useful?
Show answer
For assessing the effect of new loads or shifting loads.
Why does embodied carbon grow in relative importance?
Show answer
Operational emissions fall as electricity decarbonizes.
Name the five accounting principles.
Show answer
Relevance, completeness, consistency, transparency, accuracy.
Lesson quiz · 5 questions
Score 60% or more to complete this lesson.
Create a free account to save your progress, take quizzes and earn a certificate.