
DCE-460 · Lesson 12 of 12 · 24 min
A sustainability strategy: case study and project
This final lesson brings the course together in a sustainability strategy for an operating data centre and its planned expansion. A strategy turns the measures of the previous lessons into a prioritized, funded, measurable plan, with targets that stakeholders can trust and a reporting approach that shows progress honestly. The lesson follows a case study from baseline to roadmap, uses a marginal abatement cost curve to prioritize measures, addresses trade-offs between carbon, water and cost, and sets out the course project, in which you prepare a strategy for a facility of your choice.
The case study facility
The facility is a colocation data centre with 20 MW of IT capacity, running at an average of 80 % load, in a region with warm summers, cold winters and moderate water stress. It is connected to a grid with an average intensity of about 300 g CO₂e/kWh that is slowly decarbonizing. It was built in 2015 with chilled water cooling, evaporative cooling towers, 2N UPS and raised-floor air distribution without full containment. The owner plans a 30 MW expansion with liquid cooling for AI customers. Customers, especially two large technology companies, have asked for hourly clean energy data and a credible decarbonization plan, and the municipality has asked whether the expansion can supply heat to a planned residential district.
Step 1: establish the baseline
A strategy starts with measured facts. The team assembled a baseline for the most recent full year:
- Energy: 182,000 MWh total, annual PUE 1.30 measured at category 2 (Lesson 2), with summer peaks of 1.42.
- Water: 240,000 m³ of potable water, WUE 1.7 L/kWh, mostly evaporated in the cooling towers at 3 cycles of concentration (Lesson 6).
- Emissions: location-based Scope 2 about 54,600 t; market-based about the same, since no clean energy had been procured; Scope 1 about 600 t, mostly refrigerant top-ups; Scope 3 not yet estimated (Lesson 7).
- IT: a survey of the owner's own enterprise servers in the facility found 14 % comatose and average utilization of 12 % (Lesson 5); customer IT is outside the owner's control but can be influenced.
- Hourly clean energy: grid supply was about 35 % carbon-free on an hourly basis.
The baseline revealed data gaps: meters for individual cooling plant components, hourly consumption data for customers, and refrigerant records. Fixing them was the first action.
Step 2: identify and prioritize measures
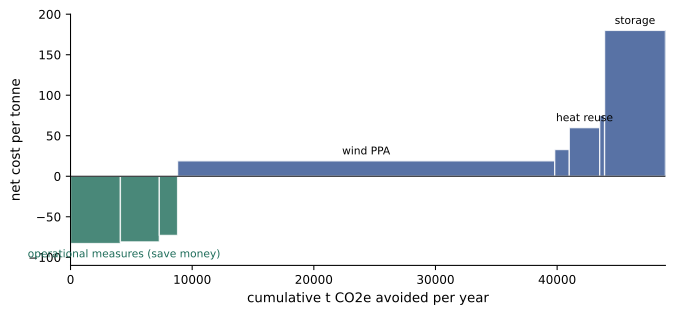
The team listed candidate measures from every area of the course and estimated, for each, the annual emissions avoided and the annualized net cost (capital cost spread over its life plus operating costs, minus energy and water savings). Ranking measures by cost per tonne produces a marginal abatement cost (MAC) curve: measures with negative cost save money and should be done first, and the curve shows how much reduction is available at each price.
# Marginal abatement cost curve for a 20 MW facility on a 300 g/kWh grid (illustrative)
measures = [
    # name, annual t CO2e avoided, annualized net cost per year (negative = saving)
    ("Raise supply temperatures, airflow fixes", 3200, -260000),
    ("Remove comatose servers, consolidate", 4100, -340000),
    ("UPS eco-mode and module management", 1500, -110000),
    ("Refrigerant leak control, low-GWP retrofit", 400, 30000),
    ("Local wind PPA, 60 % of load", 31000, 600000),
    ("Battery storage for hourly matching", 5000, 900000),
    ("Heat reuse to district network", 2500, 150000),
    ("Low-carbon concrete in expansion", 1200, 40000),
]
rows = sorted(measures, key=lambda m: m[2] / m[1])
cum = 0
print("Measure                                        t/yr    cost/t   cumulative t")
for name, t, cost in rows:
    cum += t
    print(f"{name:<45} {t:6,d} {cost / t:8.0f} {cum:12,d}")
neg = sum(t for _, t, c in rows if c < 0)
print(f"Measures that save money: {neg:,d} t/yr; total potential {cum:,d} t/yr")Measure t/yr cost/t cumulative t Remove comatose servers, consolidate 4,100 -83 4,100 Raise supply temperatures, airflow fixes 3,200 -81 7,300 UPS eco-mode and module management 1,500 -73 8,800 Local wind PPA, 60 % of load 31,000 19 39,800 Low-carbon concrete in expansion 1,200 33 41,000 Heat reuse to district network 2,500 60 43,500 Refrigerant leak control, low-GWP retrofit 400 75 43,900 Battery storage for hourly matching 5,000 180 48,900 Measures that save money: 8,800 t/yr; total potential 48,900 t/yr
Three operational measures, consolidating and removing comatose servers, raising supply temperatures with airflow fixes, and UPS eco-mode with module management, together avoid about 8,800 t a year while saving money. A local wind PPA delivers by far the largest reduction, about 31,000 t, at a modest cost per tonne. Heat reuse, low-carbon concrete for the expansion and a refrigerant programme follow at moderate cost, and storage for hourly matching is the most expensive per tonne but necessary for high hourly CFE. Together the measures could avoid nearly 49,000 t of the facility's roughly 55,000 t of operational emissions. A MAC curve is a guide, not a verdict: measures interact (efficiency reduces the energy the PPA must cover), costs are uncertain, and some measures have value beyond carbon, such as water savings or customer requirements.
Step 3: address water and other trade-offs
Carbon is not the only goal. For water, the team raised cycles of concentration to 6 with improved treatment, switched the towers to reclaimed water from a nearby treatment plant, and specified the expansion with liquid cooling at 40 °C supply and dry coolers with adiabatic assistance only above 30 °C, cutting the expansion's water use by about 90 % compared with the original design, at an energy penalty that the clean energy procurement covers. For the existing hall, they evaluated replacing the towers with dry coolers but deferred it, because the energy penalty on the current grid outweighed the water savings in a moderately stressed basin; the decision will be revisited as the grid decarbonizes. These trade-offs were documented so that stakeholders can see the reasoning.
Step 4: set targets
Good targets are specific, measurable, time-bound and consistent with recognized frameworks. The team proposed:
- Annual PUE of 1.22 for the existing hall by 2028 and design PUE below 1.15 for the expansion.
- WUE below 0.5 L/kWh for the portfolio by 2030, with no potable water for cooling.
- 100 % annual renewable matching from additional, local projects by 2028, and hourly CFE of at least 80 % by 2030 and 90 % by 2035.
- Scope 1 and 2 reductions aligned with a 1.5 °C pathway, submitted for validation by the Science Based Targets initiative, and a Scope 3 inventory including embodied carbon by 2027.
- Heat delivery to the residential district from the expansion's first phase, targeting an ERF of 0.2 by 2031.
Targets were presented with their baselines and methods so that progress reports would be comparable year to year.
Step 5: build the roadmap and governance
The roadmap sequences measures by cost, dependency and timing: quick operational wins in the first year, metering and data systems in parallel, PPA negotiation in the first two years (as new projects take time to build), heat reuse integrated with the expansion design, and storage and firm clean energy later as costs fall and contracts become available. Each measure has an owner, a budget and a measurement plan. Governance includes a sustainability steering group with operations, engineering, procurement, finance and customer representatives; quarterly reviews of metrics; integration with the change management and capital planning processes (DCE-450, Lesson 9); and annual public reporting with third-party assurance (Lesson 11). Financing combines operating budgets for quick wins, capital budgets for retrofits, and green or sustainability-linked financing for the expansion, which the strategy's credible targets help to secure.
Worked problem
Checking progress after one year
After the first year, the facility's annual PUE has fallen from 1.30 to 1.25, IT load is unchanged, the PPA is signed but its wind farm is not yet operating, and grid intensity has fallen from 300 to 285 g/kWh. Estimate the change in location-based Scope 2 emissions and explain the drivers.
Show solution
- IT energy: 182,000 / 1.30 = 140,000 MWh. New facility energy: 140,000 × 1.25 = 175,000 MWh.
- Location-based emissions: before 182,000 × 0.300 = 54,600 t; after 175,000 × 0.285 = 49,900 t.
- Reduction about 4,700 t (8.6 %): about 2,100 t from efficiency (7,000 MWh at 300 g/kWh) and about 2,600 t from the cleaner grid.
Answer: Emissions fell by about 9 %, with efficiency and grid decarbonization contributing roughly equally. Reporting should separate these drivers, so that the organization does not take credit for grid changes it did not cause, and should explain that the PPA's effect will appear once the wind farm operates.
Course project
Prepare a sustainability strategy for a data centre of at least 2 MW of IT load: a real facility you can obtain data for, a published case, or a realistic hypothetical facility. Your strategy should include:
- A description of the facility, its location, grid, climate and water context.
- A baseline with PUE, WUE, CUE, REF, ERF, Scope 1, location- and market-based Scope 2, an estimate of Scope 3 embodied carbon, and hourly CFE, stating methods and assumptions.
- At least eight candidate measures across infrastructure efficiency, IT efficiency, water, clean energy, heat reuse and embodied carbon, each with estimated impact and cost, ranked in a MAC curve.
- An analysis of at least one significant trade-off, such as water versus energy or server refresh versus embodied carbon.
- Targets with baselines, deadlines and alignment to recognized frameworks.
- A roadmap, governance and reporting plan, including the regulations and disclosure requirements that apply in your country.
For a Canadian facility, address the provincial grid's carbon intensity and clean energy options, provincial water permitting, applicable building energy and embodied carbon requirements, the CSSB standards and, where relevant, OSFI B-15 expectations of lenders, and the Competition Act's rules on environmental claims.
Projects are assessed on the quality of the baseline and methods, the realism of measures and costs, the clarity of trade-off reasoning, the credibility of targets, and the honesty of the reporting plan.
Strategies also need a communication plan. Customers, employees, investors and the local community each need different information, at different levels of detail, and all of it must be consistent with the formal reports. Explaining what has been achieved, what remains difficult, and why certain trade-offs were made builds credibility that a list of achievements alone cannot.
Above all, a strategy is a living document, revisited each year as technology, prices, regulations and the grid change.
Common mistakes
MistakeSetting targets before establishing a measured baseline.
InsteadMeasure first, fix data gaps, then set targets.
MistakeTreating a MAC curve as a final answer.
InsteadAccount for interactions, uncertainty and non-carbon benefits.
MistakeTaking credit for grid decarbonization.
InsteadSeparate the drivers of change in progress reports.
MistakeOptimizing carbon while ignoring water.
InsteadDocument trade-offs and revisit them as conditions change.
MistakeLeaving the strategy without owners and budgets.
InsteadAssign owners, funding, governance and reporting for each measure.
Summary and key terms
- A strategy turns measures into a prioritized, funded and measurable plan.
- Start with a measured baseline and fix data gaps.
- MAC curves rank measures by cost per tonne; operational efficiency often saves money.
- Clean energy procurement usually provides the largest reductions; storage and firm power complete hourly matching.
- Water, heat reuse and embodied carbon require explicit trade-off decisions.
- Targets must be specific, time-bound, baselined and aligned with frameworks.
- Roadmaps, governance, financing and assured reporting carry the strategy through.
- Baseline
- The measured starting point for targets and progress.
- MAC curve
- Marginal abatement cost curve ranking measures by cost per tonne.
- Annualized cost
- Capital and operating costs expressed per year over a measure's life.
- Abatement
- Reduction of emissions.
- Science-based target
- An emissions target consistent with climate science, often validated by SBTi.
- Roadmap
- A sequenced plan of measures over time.
- Steering group
- A cross-functional group governing the strategy.
- Sustainability-linked loan
- A loan whose terms depend on meeting sustainability targets.
- Driver analysis
- Separating the causes of changes in a metric.
- Interaction effect
- The influence of one measure on another's impact.
Practice problems
Work each problem on paper first, then reveal the answer to check.
What was the first action after the baseline in the case study?
Show answer
Fixing data gaps in metering, customer consumption and refrigerant records.
What does the width of a MAC curve bar represent?
Show answer
The tonnes of emissions avoided per year.
From the output, which measures save money?
Show answer
Consolidation, raising temperatures with airflow fixes, and UPS eco-mode.
From the output, which single measure gives the largest reduction?
Show answer
The local wind PPA, about 31,000 t a year.
Why must measure interactions be considered?
Show answer
Efficiency reduces the energy that procurement must cover, so impacts are not simply additive.
Why was replacing the existing towers with dry coolers deferred?
Show answer
The energy penalty on the current grid outweighed the water savings in a moderately stressed basin.
Name three properties of a good target.
Show answer
Specific, measurable, time-bound, baselined, aligned with frameworks.
In the example, how much of the reduction came from efficiency?
Show answer
About 2,100 t of the 4,700 t.
Why separate efficiency and grid effects in reports?
Show answer
To avoid taking credit for changes the organization did not cause.
List four components of the course project.
Show answer
Facility description, baseline, measures with MAC curve, trade-off analysis, targets, roadmap and reporting.
Lesson quiz · 5 questions
Score 60% or more to complete this lesson.
Create a free account to save your progress, take quizzes and earn a certificate.