
CRE-499 · Lesson 8 of 12 · 30 min
The mid-term analytics review
Around week 9, stop and look hard at what has happened so far. The mid-term review is where you compare results with the goals in your charter, judge your first experiment, find the content and habits that are working and decide what to change for the second half of term. It applies the analytics skills from CRE-202 and the strategy, statistics and interpretation methods from CRE-440. The deliverable is a written review of three to four pages with charts, an experiment report and an updated charter and calendar.
A good review is honest. It reports disappointing numbers as clearly as good ones, separates signal from noise and ends with specific decisions. A review that celebrates every number or explains away every problem teaches nothing. Your instructor is looking for clear thinking about evidence, not for impressive totals.
Preparing the data
Export or copy the metrics you have logged weekly since launch, and pull a few extra views from your analytics: traffic sources, audience retention curves for each long video, returning versus new viewers, top search terms and subscriber sources. Put everything in one spreadsheet with dates. Note anything unusual that may distort the numbers, such as an external share, a collaboration, a holiday or a platform change. CRE-440 explained that platform metric definitions change from time to time; at the time of writing (October 2026), for example, YouTube counts Shorts views differently from before March 2025 and also reports engaged views, so check definitions before comparing periods.
The north star and its drivers
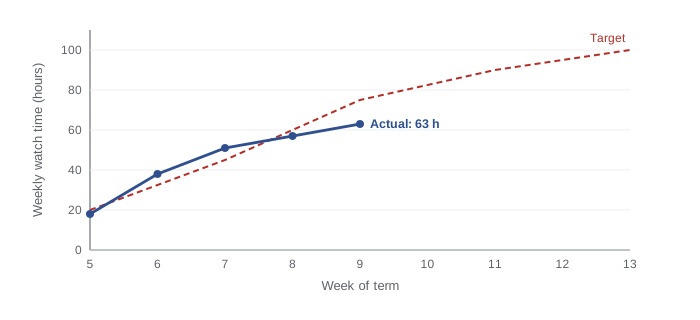
Start with your north star metric, usually weekly watch time. Plot it week by week and compare it with your target. Then break it into drivers. Weekly watch time equals views times average view duration; views come from impressions times CTR plus views from other sources such as external links. Breaking the north star down shows where growth or weakness comes from.
Worked problem
Breaking down a change in watch time
In weeks 7 and 9 Jordan's channel recorded the following. Week 7: 1,020 views, average view duration 3.0 minutes. Week 9: 1,400 views, average view duration 2.7 minutes. Calculate watch time for each week and explain the change.
Show solution
- Week 7: \( 1{,}020 \times 3.0 = 3{,}060 \) minutes, or 51 hours.
- Week 9: \( 1{,}400 \times 2.7 = 3{,}780 \) minutes, or 63 hours.
- Views rose by \( 380 / 1{,}020 \approx 37 \% \); average view duration fell by 10 %.
- Watch time rose by \( 720 / 3{,}060 \approx 24 \% \).
Answer: Watch time grew about 24 % because views grew faster than duration fell. The drop in duration is worth investigating: new viewers from a short or a broader audience may be less committed, or a newer video may be less engaging. Checking retention by video and traffic source will tell which.
Retention curves
Audience retention curves show what percentage of viewers are still watching at each moment of a video. Look for three things. The opening drop: how many leave in the first thirty seconds, which reflects whether the hook matches the packaging. Steady slopes: gradual decline is normal; sharp drops point to slow sections, off-topic tangents or repeated content. Bumps: rises show moments people rewind or share, which tell you what viewers value most.
Compare curves across your videos. If every video loses 40 % in the first thirty seconds, your opening template needs work. If one section type, such as a long introduction about tools, causes drops every time, cut or shorten it. CRE-202 described these patterns; the review is where you act on them systematically.
Cohorts and returning viewers
A cohort is a group of viewers who share a starting point, such as subscribers gained in a particular week. Cohort analysis asks whether people who found you keep coming back. For a small channel, a simple version works: of the viewers who first watched in launch week, what share watched again in later weeks? Returning viewers are a strong sign that the channel delivers lasting value, and CRE-440 explained why they matter more than raw totals.
Worked problem
Reading a simple cohort table
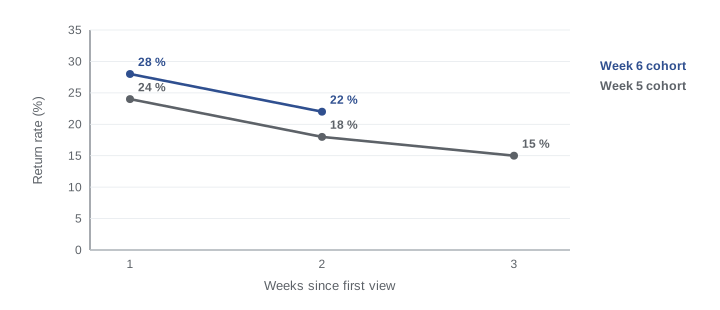
Of 300 viewers who first watched in launch week (week 5), 72 returned in week 6, 54 in week 7 and 45 in week 8. Of 250 who first watched in week 6, 70 returned in week 7 and 55 in week 8. Calculate the one-week and two-week return rates for each cohort.
Show solution
- Week 5 cohort: one week \( 72/300 = 24 \% \); two weeks \( 54/300 = 18 \% \); three weeks \( 45/300 = 15 \% \).
- Week 6 cohort: one week \( 70/250 = 28 \% \); two weeks \( 55/250 = 22 \% \).
Answer: The newer cohort returns at a higher rate (28 % against 24 % after one week, 22 % against 18 % after two). That suggests the channel is improving at turning new viewers into regulars, perhaps because of better content or a clearer series. With small groups, though, a few viewers either way change the rates, so treat this as encouraging rather than proven.
Judging the experiment
Report your experiment in a standard structure: hypothesis, design, decision rule set in advance, results with uncertainty, conclusion and what you will do next. Report the result even if it is null or negative. A clean null result ('the close-up thumbnail did not measurably beat the wide shot') is useful knowledge and earns full credit if the experiment was designed and reported well.
Worked problem
A two-proportion comparison
Jordan compared two packaging styles across similar videos using the same traffic source. Style A: 3,600 impressions, 180 clicks. Style B: 3,400 impressions, 214 clicks. Is B's higher CTR likely to be real?
Show solution
- CTRs: \( p_A = 180/3{,}600 = 0.050 \); \( p_B = 214/3{,}400 \approx 0.063 \).
- Pooled rate: \( p = (180 + 214)/(3{,}600 + 3{,}400) = 394/7{,}000 \approx 0.0563 \).
- Standard error: \( \sqrt{0.0563 \times 0.9437 \times (1/3{,}600 + 1/3{,}400)} \approx \sqrt{0.0531 \times 0.000572} \approx 0.0055 \).
- Test statistic: \( z = (0.063 - 0.050)/0.0055 \approx 2.4 \).
Answer: A z of about 2.4 is beyond 1.96, so the difference is unlikely to be pure chance at the usual 5 % level. Because the comparison used different videos rather than a randomized test, topic differences could still explain some of the gap; Jordan should adopt style B and confirm with a proper Test & Compare test when a suitable video appears.
Avoiding interpretation traps
CRE-440 listed the common traps. Check each before drawing conclusions.
- Regression to the mean: an unusually good video is often followed by a more ordinary one. Do not abandon a format because the follow-up to a hit did worse.
- Small samples: with a few hundred viewers, rates jump around. Use intervals and look for consistent patterns across several videos.
- Seasonality and events: holidays, exams and external shares change behaviour. Note them and compare like with like.
- Survivorship: studying only your best videos hides what failed. Look at the full set.
- Correlation is not causation: a video with a longer title may have done better for other reasons.
- Metric changes: confirm that definitions did not change between periods.
From findings to decisions
End the review with a short list of decisions, each linked to evidence. Good decisions are specific and testable: 'Shorten the tool introduction to under 20 seconds because all four long videos lose more than 15 % of viewers during it,' or 'Move one weekly short slot from repurposed clips to quick answers to viewer questions, because question shorts earned twice the views and three times the subscribers.' Decide also what you will stop doing; capacity freed from weak work funds stronger work.
| Finding | Evidence | Decision |
|---|---|---|
| Long tool introductions lose viewers | 15 to 22 % drop in the first 45 seconds of every long video | Cut introductions to 20 seconds and show the finished repair first |
| Question shorts outperform repurposed clips | 2.1× views and 3× subscribers per short | Make two of three weekly shorts quick answers |
| Watch time below target trajectory | 63 h against 75 h target in week 9 | Revise target to 85 h by week 13 and add one search-led video |
| Newsletter growth slow | 41 subscribers against 75 planned | Add printable checklist as lead magnet; mention in every short |
| Editing still takes 3 h | Log weeks 5 to 9 | Build an editing template and batch thumbnails |
Updating the charter and calendar
Revise the charter where the evidence demands it, and record each change with the reason. Lowering a target because it was unrealistic is a professional decision if you explain it; quietly changing it is not. Update the calendar for weeks 10 to 14 with the decisions above, check capacity again and rebuild the buffer if it has shrunk. Note the remaining deliverables: the monetization pilot, media kit, business plan and presentation all depend on the run phase continuing smoothly.
Worked problem
Revising a target with a stated reason
Jordan's charter target was 100 hours of weekly watch time by week 13. Weekly watch time has grown from 18 to 63 hours over weeks 5 to 9, but growth has slowed to about 6 hours a week over the last two weeks. If that pace continues, what will watch time be in week 13, and what revised target is reasonable?
Show solution
- Weeks remaining: \( 13 - 9 = 4 \).
- Projected watch time: \( 63 + 4 \times 6 = 87 \) hours.
- A modest improvement from the decisions above might add a few hours a week.
Answer: At the current pace the channel would reach about 87 hours, short of 100. A revised target of 85 to 90 hours, with the reason recorded (growth slowed after the launch boost), is realistic. The original target was not foolish; it simply assumed the launch rate would continue.
Presenting the review
Write the review so that a busy reader can follow it in five minutes. Open with a short summary of three or four sentences: where the channel stands against its goals, the most important finding and the main decisions. Then give the evidence in a few clear charts, each with a one-line takeaway as its title, such as 'Watch time is growing but below the target path' or 'Question shorts outperform repurposed clips'. Put detailed tables in an appendix. End with the decisions table and the revised charter and calendar. Sharing a short version with a classmate or friend before submitting helps you see whether the story is clear, and explaining your reasoning aloud often reveals gaps in the evidence that you can fix before your instructor reads it.
Keep the spreadsheet behind the review; you will reuse the same structure for the final presentation in lesson 12, updated with the second half of term.
Common mistakes
MistakeReporting only good numbers.
InsteadPresent disappointing results clearly and learn from them.
MistakeComparing periods without checking metric definitions.
InsteadConfirm definitions and note platform changes before comparing.
MistakeCalling a small difference a win.
InsteadUse intervals or a z-test and look for consistent patterns.
MistakeAbandoning a format after one weaker follow-up.
InsteadRemember regression to the mean and judge across several pieces.
MistakeEnding the review with observations but no decisions.
InsteadList specific, evidence-linked decisions and record charter changes with reasons.
Summary and key terms
- The mid-term review compares results with goals, judges experiments and sets decisions for the second half.
- Gather logged data, note unusual events and confirm metric definitions.
- Break the north star into drivers such as views and average view duration.
- Retention curves reveal weak openings, slow sections and valued moments.
- Cohort return rates show whether new viewers become regulars.
- Report experiments in a standard structure with uncertainty, including null results.
- Check interpretation traps, turn findings into decisions and update the charter with reasons.
- Mid-term review
- A structured evaluation of progress halfway through a project.
- Driver
- A component metric that combines to produce a higher-level metric.
- Average view duration
- The mean time viewers spend watching a video.
- Retention curve
- A chart of the share of viewers still watching at each moment.
- Cohort
- A group of viewers sharing a starting point, such as first-view week.
- Return rate
- The share of a cohort that watches again later.
- Null result
- An experiment that finds no measurable difference.
- z-statistic
- A standardized measure of how far a difference is from zero in standard errors.
- Regression to the mean
- The tendency for extreme results to be followed by more typical ones.
- Target trajectory
- The path a metric must follow to reach its goal on time.
Practice problems
Work each problem on paper first, then reveal the answer to check.
1,500 views at 2.4 minutes average. Watch time in hours?
Show answer
3,600 minutes, 60 hours.
What does a large drop in the first 30 seconds suggest?
Show answer
The hook or opening does not match the packaging or fails to hold viewers.
Of 400 first-week viewers, 88 return the next week. Return rate?
Show answer
22 %.
Why report null results?
Show answer
They are useful knowledge and show honest, well-run experimentation.
CTRs 4 % and 5 % with standard error 0.4 percentage points. z?
Show answer
2.5, beyond 1.96.
Name three interpretation traps.
Show answer
Regression to the mean, small samples, seasonality, survivorship, correlation versus causation, metric changes (any three).
Turn this finding into a decision: question shorts get twice the views.
Show answer
Shift more short slots to answering viewer questions.
Watch time is 70 h, growing 5 h a week, 4 weeks to go. Projection?
Show answer
90 hours.
How should a target change be recorded?
Show answer
In the charter, with the reason and evidence.
Why check returning viewers as well as totals?
Show answer
They show whether the channel delivers lasting value.
Lesson quiz · 5 questions
Score 60% or more to complete this lesson.
Create a free account to save your progress, take quizzes and earn a certificate.