
CRE-440 · Lesson 7 of 12 · 32 min
Interpreting results and avoiding traps
Running an experiment is only half the work. The other half is interpreting the result correctly, and this is where many creators go wrong, even with good data. Human minds are built to find patterns and stories, and creator data offers endless opportunities to find ones that are not there. This lesson describes the most common traps in interpreting creator data: regression to the mean, survivorship bias, seasonality, novelty effects, algorithm and platform changes, Simpson's paradox, and confusing correlation with causation. For each, it gives a way to recognize it and a way to guard against it.
Regression to the mean
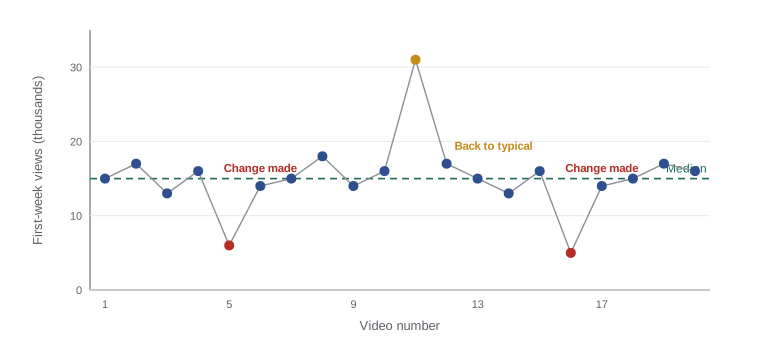
Regression to the mean is the tendency for unusually high or low results to be followed by results closer to the average, simply because extreme results usually include a large dose of luck. If a video performs far above your typical level, the next one will probably perform worse, not because you did anything wrong, but because the first result was partly lucky. Likewise, after a very weak video, the next one will probably do better, whatever you change.
This creates a dangerous illusion. Creators tend to make changes after a disappointing video, and the next video usually improves, so the change appears to have worked. Creators also tend to keep doing the same thing after a hit, and the next video usually does worse, so they conclude the audience is tiring. Both conclusions can be pure regression to the mean.
Worked problem
A change that seemed to work
A creator's median first-week views are 15,000. One video gets only 6,000, so the creator redesigns the thumbnail template. The next video gets 13,500. Did the new template work?
Show solution
- The 6,000 result was 9,000 below the median, an unusually weak result.
- Regression to the mean predicts the next video will likely land closer to 15,000 regardless of any change.
- The next video's 13,500 is close to normal, which is exactly what regression to the mean predicts.
Answer: There is no evidence yet that the template helped. To learn whether it did, compare it against the median over several videos, or better, test it with Test & Compare on the same video.
The guard against regression to the mean is to compare results against a stable baseline, such as the median of many videos, rather than against the previous result, and to use controlled designs whenever possible.
Survivorship bias
Survivorship bias occurs when you study only the examples that succeeded and ignore the ones that failed, which leads to false conclusions about what causes success. Creators encounter it constantly. Advice from very successful creators, lists of features shared by viral videos, and case studies of channels that grew quickly all focus on survivors. If thousands of creators used the same tactics and failed, those failures are invisible.
Worked problem
Survivorship in viral video analysis
A creator studies their 10 best-performing videos and notices that 8 of them have a face with a surprised expression in the thumbnail. They conclude surprised faces drive views. What is missing from the analysis?
Show solution
- The analysis looks only at successful videos.
- If 80 % of all their videos use surprised faces, then 8 of the top 10 having them is exactly what you would expect by chance.
- The right comparison is the share of surprised-face thumbnails among top videos versus among all videos.
Answer: Without the base rate across all videos, the pattern means nothing. If, say, 45 % of all thumbnails had surprised faces but 80 % of top performers did, that would be a more interesting signal, and still worth testing directly.
The guard is to compare successes with the full population, including failures, and to treat lists of winners' habits as hypotheses to test, not as proven recipes.
Seasonality and calendar effects
Viewing behaviour changes across the year, the week and the day. Gift guides surge in November and December; fitness content in January; back-to-school content in August and September; tax content in the spring, with Canada's April 30 filing deadline and the US April 15 deadline creating slightly different peaks. Weekends differ from weekdays, and holidays such as Canadian Thanksgiving in October and US Thanksgiving in November shift viewing patterns. Any comparison across periods must account for these effects, as lesson 5 showed with seasonal adjustment.
| Pattern | Example | Guard |
|---|---|---|
| Annual cycle | Fitness content peaks in January | Compare with the same month last year |
| Holiday effects | Lower viewing on some holidays, higher on others | Avoid holidays in test windows or adjust for them |
| Day of week | Weekend viewing differs from weekdays | Use full weeks; compare equal days |
| Event-driven spikes | A product launch or news story | Note events in your log and exclude or separate them |
Novelty and fatigue effects
When something changes, audiences often react to the change itself. A new thumbnail style may attract extra clicks at first simply because it looks different from what returning viewers are used to, and the effect may fade as it becomes familiar. This is a novelty effect. The opposite, a change effect or temporary dip, can happen when returning viewers are briefly confused by a new look. Over longer periods, audiences can also tire of a repeated format, called fatigue. Both mean that short tests can overstate or understate long-term effects.
Worked problem
Spotting a novelty effect
After switching to a bold new thumbnail style, click-through rates on new videos were 7.2 %, 6.8 %, 6.1 %, 5.6 % and 5.4 % over five consecutive uploads. The previous style averaged 5.3 %. What does the pattern suggest?
Show solution
- The first video shows a large jump, 1.9 points above the old average.
- The advantage shrinks with each upload: 1.5, 0.8, 0.3 and 0.1 points.
- By the fifth upload, performance is close to the old average.
Answer: This is a classic novelty effect. The new style's long-term benefit appears small. Judging it after the first two uploads would have greatly overstated its value.
The guard is to run tests long enough to see past initial reactions, to compare new and returning viewers separately where possible, and to re-check important changes after a few months.
Algorithm and platform changes
Platforms change their recommendation systems, interfaces and metric definitions frequently, often without detailed announcements. A sudden change in your numbers may reflect a platform update rather than anything you did. Lesson 3 showed how YouTube's 2025 change in Shorts view counting could make growth appear much larger than it was. Interface changes, such as a new placement for Shorts in the app or a redesign of the home feed, can shift traffic sources overnight.
Guards include keeping a log of known platform changes, watching creator communities and official platform blogs for announcements, comparing your trends with those of similar creators where possible, and using metrics such as watch time or engaged views that are less sensitive to counting changes.
Simpson's paradox
Simpson's paradox occurs when a trend that appears in several groups reverses or disappears when the groups are combined. It arises when the groups differ in size and their mix changes. Lesson 3 showed a version with click-through rates by traffic source. It also appears when comparing formats or platforms.
Worked problem
Simpson's paradox in a format comparison
A creator compares tutorials and vlogs. Tutorials: 30 videos with 20,000 average views from search-heavy topics, and 10 with 5,000 on niche topics. Vlogs: 5 videos at 22,000 on search-heavy topics and 25 at 6,000 on niche topics. Which format does better within each topic type, and overall?
Show solution
- Search-heavy topics: vlogs average 22,000 versus tutorials 20,000, so vlogs win.
- Niche topics: vlogs average 6,000 versus tutorials 5,000, so vlogs win.
- Tutorials overall: (30 × 20,000 + 10 × 5,000) ÷ 40 = 650,000 ÷ 40 = 16,250.
- Vlogs overall: (5 × 22,000 + 25 × 6,000) ÷ 30 = 260,000 ÷ 30 ≈ 8,667.
Answer: Vlogs win within both topic types, but tutorials win overall because most tutorials covered search-heavy topics while most vlogs covered niche ones. The overall comparison is misleading; the within-group comparison is the fair one.
The guard is to compare like with like: break results down by the factors that might differ between groups, such as topic type, traffic source or video length, before drawing conclusions.
Correlation is not causation
Two metrics that move together are correlated, but that does not mean one causes the other. Videos with more comments may get more views because the algorithm rewards engagement, or because popular topics generate both comments and views. Longer videos may correlate with higher revenue because they allow more ad breaks, or because the creator makes longer videos on topics advertisers value. To establish cause, you need an experiment or a careful design that rules out the other explanations.
Worked problem
A misleading correlation
A creator notices that videos published on Fridays average 30 % more views than videos published on Tuesdays. Over the past year, most Friday videos were big-budget specials and most Tuesday videos were quick updates. Should the creator move all uploads to Friday?
Show solution
- Day of week and video type are mixed together: Fridays had mostly specials.
- Specials may get more views on any day because they are more ambitious.
- The correlation between Friday and views may be caused by video type, not day.
Answer: Not yet. A fair test would publish similar videos on each day, for example in a switchback design alternating days over several weeks, to separate the effect of the day from the effect of the content.
A short interpretation checklist
Before acting on any result, ask these questions.
- Am I comparing against a stable baseline or just the last result?
- Am I looking only at successes?
- Could season, holidays or events explain this?
- Could this be a novelty effect that will fade?
- Did the platform change anything in this period?
- Would the result hold within subgroups, or is it a mix effect?
- Is this a correlation that needs an experiment to confirm cause?
No experiment is perfect, and creators must still make decisions with incomplete evidence. The goal is not certainty but calibrated confidence: acting boldly on strong evidence, cautiously on weak evidence, and always leaving room to learn more.
Writing up results honestly
How you record a result shapes what you and your team will believe later. A good write-up states the original hypothesis and prediction, the design, the result with its uncertainty, the traps you checked for, and the decision. It avoids overclaiming: "Retention at 30 seconds rose by about 4 points across eight videos; the 95 % interval was roughly 1 to 7 points; we adopted the change and will recheck in three months for novelty effects" is far more useful than "The new intro works." Honest write-ups make it easier to revisit decisions when new evidence arrives.
Common mistakes
MistakeCrediting a change because the next video improved after a weak one.
InsteadCompare against a stable baseline; extreme results usually regress toward the median.
MistakeCopying habits shared by viral videos without checking the base rate.
InsteadCompare winners with all videos, including failures, before drawing conclusions.
MistakeJudging a new style after one or two uploads.
InsteadRun long enough to see past novelty effects and recheck later.
MistakeComparing formats overall when their topic mixes differ.
InsteadBreak results down by topic type or traffic source to avoid Simpson's paradox.
MistakeAssuming correlation proves cause.
InsteadConfirm causal claims with an experiment that controls other explanations.
Summary and key terms
- Regression to the mean makes changes after weak videos look effective and repeats after hits look tired.
- Survivorship bias comes from studying only successes; always compare with the full population.
- Seasonality and calendar effects require comparing like periods and logging events.
- Novelty effects can make new styles look better at first; fatigue can make repeated formats decline.
- Platform and algorithm changes can shift numbers overnight; log them and use robust metrics.
- Simpson's paradox reverses trends when group mixes differ; compare within groups.
- Correlation does not prove causation; experiments are needed to establish cause.
- Regression to the mean
- The tendency of extreme results to be followed by results closer to the average.
- Survivorship bias
- Drawing conclusions from successes while ignoring failures.
- Base rate
- How common a feature is in the whole population, used for comparison.
- Seasonality
- Predictable changes in behaviour at certain times of year, week or day.
- Novelty effect
- A temporary boost caused by the newness of a change.
- Fatigue
- A decline in response to a repeated format or style over time.
- Simpson's paradox
- A trend within groups that reverses or disappears when groups are combined.
- Correlation
- A statistical association between two variables.
- Causation
- A relationship where changing one variable produces a change in another.
- Calibrated confidence
- Confidence that matches the strength of the evidence.
Practice problems
Work each problem on paper first, then reveal the answer to check.
A creator's worst video is followed by a better one after a change. What trap might explain it?
Show answer
Regression to the mean.
What is the right comparison when studying top videos?
Show answer
The share of a feature among top videos versus among all videos.
Name two calendar effects.
Show answer
Annual cycles, holidays, day of week, event spikes.
CTRs after a change: 8, 7, 6, 5.5, 5.4 % versus an old 5.3 %. What effect is this?
Show answer
A novelty effect.
How can you guard against platform changes?
Show answer
Log them, follow announcements, compare with peers and use robust metrics.
Define Simpson's paradox.
Show answer
A trend within groups reverses when groups are combined because of different mixes.
Group A: 10 videos at 10,000. Group B: 30 videos at 2,000. What is the combined average?
Show answer
(100,000 + 60,000) ÷ 40 = 4,000.
Why might comments correlate with views without causing them?
Show answer
Popular topics may generate both.
What design separates day-of-week effects from content type?
Show answer
A switchback publishing similar videos on alternating days.
What is calibrated confidence?
Show answer
Confidence that matches the strength of the evidence.
Lesson quiz · 5 questions
Score 60% or more to complete this lesson.
Create a free account to save your progress, take quizzes and earn a certificate.