
CRE-440 · Lesson 11 of 12 · 34 min
Annual and quarterly planning
Strategy sets direction; planning turns it into a calendar of work you can actually deliver. Many creators skip formal planning because their work feels too unpredictable, and it is true that algorithms, trends and life events constantly interrupt plans. But the alternative, deciding each week what to make next, usually leads to reactive content, uneven quality and burnout. Good planning does not try to predict everything. It sets clear priorities, matches ambitions to real capacity, prepares for different futures and builds in regular moments to adjust. This lesson covers the annual and quarterly planning cycle: capacity planning, roadmaps, scenario planning, pre-mortems, updating forecasts as evidence arrives, and running quarterly reviews.
The planning cycle
A practical rhythm for most creators has three layers.
- Annual: revisit vision and positioning, set yearly objectives, choose the major bets for the year and outline a rough roadmap.
- Quarterly: set OKRs for the next three months, plan content and experiments in detail, and review the last quarter's results.
- Monthly and weekly: schedule production, read experiment results and make small adjustments.
Each layer is lighter than the one above it. An annual plan might take a day or two; a quarterly plan half a day; a weekly check-in an hour.
Capacity planning
The most common planning failure is promising more than you can deliver. Capacity planning starts with the hours you actually have, not the hours you wish you had. Subtract time for administration, email, sponsor management, community, learning and rest, then estimate how much production work remains. Then compare that with the hours each piece of content really takes, based on your own records rather than optimistic guesses.
Worked problem
Quarterly capacity for a solo creator
A creator works 40 hours a week for 13 weeks but plans two weeks off. Administration, email and sponsors take 8 hours a week; community and livestream prep take 4 hours; learning and experiments take 3 hours. A long video takes 24 hours and a short clip 2 hours. How many long videos and clips fit if the creator wants 8 clips for every long video?
Show solution
- Working weeks: 13 − 2 = 11.
- Production hours per week: 40 − 8 − 4 − 3 = 25.
- Production hours per quarter: 11 × 25 = 275.
- One bundle of 1 long video plus 8 clips takes 24 + 8 × 2 = 40 hours.
- Bundles: 275 ÷ 40 ≈ 6.9, so 6 full bundles, using 240 hours, with 35 hours spare.
Answer: About 6 long videos and 48 clips, leaving 35 hours of buffer. Planning 13 long videos, one per week, would have required more than double the real capacity.
The planning fallacy and buffers
People routinely underestimate how long tasks will take, even when they have done similar tasks before. Psychologists call this the planning fallacy. For creators, it shows up as edits that take twice as long as expected, sponsor revisions, reshoots and illness. The fix is to plan from your actual history, for example the median time your last ten videos took, and to keep a buffer of unscheduled time, often 15 to 25 % of capacity. Buffers are not wasted time; they are what make the rest of the plan reliable.
Worked problem
Using history instead of hope
A creator estimates each long video takes 18 hours. Their last eight videos actually took 22, 26, 19, 31, 24, 23, 28 and 25 hours. What should they plan with?
Show solution
- Sorted: 19, 22, 23, 24, 25, 26, 28, 31.
- Median: (24 + 25) ÷ 2 = 24.5 hours.
- The estimate of 18 hours is about 27 % below the median actual time.
Answer: Plan with about 24 to 25 hours per video, plus a buffer. Planning with 18 hours would create a quarter that falls behind from the first week.
Roadmaps
A roadmap shows the major pieces of work across the year or quarter: series launches, product releases, experiments, platform expansions and important dates such as seasonal peaks or sponsor campaigns. It is less detailed than a content calendar and more concrete than a strategy. A good roadmap makes trade-offs visible: if a course launch and a new series both land in the same month, the roadmap shows the clash before it happens.
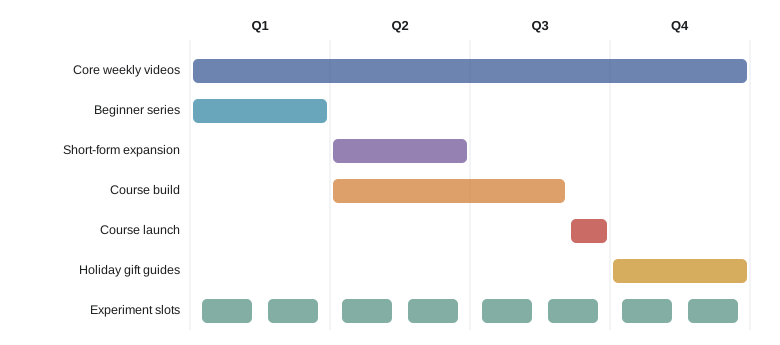
Roadmaps work best with deliberate slack. Committing every week a year ahead leaves no room for the experiments and opportunities that inevitably appear. Many creators plan the next quarter in detail, the following quarter roughly, and the rest of the year only as themes.
Scenario planning
The future is uncertain, so rather than a single forecast, plan for a few scenarios: a base case, an upside case and a downside case. For each, estimate key numbers such as views and income, and decide in advance what you would do. Scenario planning helps you avoid both overconfidence and paralysis.
Worked problem
Revenue scenarios and a downside plan
A creator expects base-case monthly income of $8,000: $4,000 sponsorships, $2,500 ad revenue and $1,500 memberships. In a downside case, sponsorships fall 50 % and ad revenue 20 %; in an upside case, sponsorships rise 30 % and memberships 20 %. Monthly costs are $5,500. Calculate each scenario and the downside gap.
Show solution
- Downside: 0.5 × 4,000 + 0.8 × 2,500 + 1,500 = 2,000 + 2,000 + 1,500 = $5,500.
- Base: $8,000.
- Upside: 1.3 × 4,000 + 2,500 + 1.2 × 1,500 = 5,200 + 2,500 + 1,800 = $9,500.
- Downside margin: $5,500 − $5,500 = $0, so the business breaks even with no buffer.
Answer: The downside case only just covers costs. A sensible plan would build a cash reserve of several months' costs and identify costs to pause, such as a freelancer's hours, if sponsorship falls.
Scenarios should also include non-financial shocks: a platform policy change, an injury, a team member leaving, or a successful video that suddenly brings a much larger audience. For each, note the early warning signs and your first response.
Pre-mortems
A pre-mortem is a planning exercise in which you imagine that the plan has already failed and ask why. Because it is framed as explaining a failure that has happened, it makes it easier to voice doubts that people might otherwise keep to themselves. A creator can run a pre-mortem alone or with their team in under an hour: write down every plausible reason the year's main bets could fail, group them, and decide which risks deserve a mitigation now.
| Imagined failure | Possible cause | Mitigation |
|---|---|---|
| Course launch sold poorly | Demand overestimated from survey intent | Run a waitlist and pre-sale before building |
| New series dropped after three episodes | Production took twice as long as planned | Plan from historical times; pilot two episodes first |
| Short-form expansion did not grow | Clips did not suit the platform | Run a 6-week test with clear stage gates |
| Burnout in the fourth quarter | Holiday sponsor rush plus course support | Book time off and limit Q4 sponsor slots |
Updating forecasts as evidence arrives
Plans should change as you learn. A useful mental model is Bayesian updating: start with a prior belief, then adjust it in proportion to how much more likely the new evidence is if your belief is true than if it is false. You do not need formal Bayesian statistics to benefit from the idea; the key is to move your confidence by the right amount, neither ignoring new evidence nor overreacting to it.
Worked problem
Updating belief in a new series
Before launch, a creator believes there is a 30 % chance a new series will become a core format. From past experience, when a series eventually succeeds, about 70 % of the time its first three episodes beat the channel median; when it fails, about 30 % of the time they still do. The first three episodes all beat the median. What is the updated chance of success?
Show solution
- Prior: P(success) = 0.30, P(failure) = 0.70.
- Probability of the evidence if successful: 0.70; if not: 0.30.
- P(evidence) = 0.30 × 0.70 + 0.70 × 0.30 = 0.21 + 0.21 = 0.42.
- Updated: 0.21 ÷ 0.42 = 0.50.
Answer: The chance of success rises from 30 % to 50 %. That is encouraging enough to continue to the next stage gate, but far from certain, which is a more measured reaction than either declaring a hit or ignoring the early results.
Quarterly reviews
At the end of each quarter, hold a review before planning the next one. A simple structure covers four questions.
- What did we plan, and what actually happened? Score the OKRs.
- What did we learn from experiments, research and results? Update the experiment log.
- What surprised us, positively or negatively? Note platform changes and external events.
- What will we start, stop and continue next quarter?
Worked problem
Rebalancing after a quarterly review
In the last quarter, a creator spent 60 % of production hours on long-form and 40 % on short-form. Long-form produced 9,000 watch hours from returning viewers and short-form brought 3,000 new viewers, of whom 10 % became returning viewers. A returning viewer generates about 3 watch hours a month. Compare watch hours per percentage point of effort over the next quarter.
Show solution
- Long-form: 9,000 watch hours ÷ 60 points = 150 watch hours per point.
- Short-form: new returning viewers = 10 % × 3,000 = 300; over three months they add 300 × 3 × 3 = 2,700 watch hours, or 2,700 ÷ 40 = 67.5 per point.
- Short-form's main value may also be discovery and longer-term growth not captured in one quarter.
Answer: On this measure long-form returns more than twice as much per unit of effort, which suggests shifting some short-form hours back, perhaps to 70/30, while keeping enough short-form to sustain discovery. Revisit after another quarter of data.
The review closes the planning loop and feeds directly into the capstone in lesson 12, where you will build a full one-year strategy.
Planning with a team
When a creator works with editors, managers or other collaborators, planning also becomes a communication tool. Share the yearly objectives and the current quarter's OKRs with everyone, agree who owns each key result and initiative, and keep the roadmap somewhere the whole team can see. A short weekly check-in covering progress, blockers and changes keeps the plan alive without heavy process. Ask team members to estimate the time for their own tasks, since the people doing the work usually estimate it best, and include their availability, holidays and training in the capacity plan.
Worked problem
Adding an editor to the capacity plan
A creator's editor works 15 hours a week for 12 weeks, with one week off. Each long video needs 10 editing hours and each clip 1 hour. If the editor handles all editing and the plan calls for 8 long videos, how many clips can the editor also cut?
Show solution
- Editor hours: 11 weeks × 15 = 165 hours.
- Long videos: 8 × 10 = 80 hours.
- Remaining: 165 − 80 = 85 hours, enough for about 85 clips.
Answer: Up to about 85 clips, though keeping some buffer, say 15 hours, leaves room for revisions and reduces the risk of overload.
Common mistakes
MistakePlanning from hoped-for production times.
InsteadPlan from the median of your actual recent times and keep a buffer.
MistakeScheduling every week of the year in detail.
InsteadPlan the next quarter in detail, the next roughly and the rest as themes.
MistakePreparing only one forecast.
InsteadPlan base, upside and downside scenarios with actions for each.
MistakeKeeping doubts about the plan unspoken.
InsteadRun a pre-mortem to surface risks and decide mitigations.
MistakeIgnoring or overreacting to early results.
InsteadUpdate beliefs in proportion to the strength of the evidence.
Summary and key terms
- Planning works in layers: annual direction, quarterly OKRs and plans, and weekly execution.
- Capacity planning starts from real available hours after overhead and rest.
- The planning fallacy means plans should use historical times and include buffers of 15 to 25 %.
- Roadmaps show major work across the year and reveal clashes, with slack for opportunities.
- Scenario planning prepares base, upside and downside responses.
- Pre-mortems imagine failure to surface risks and mitigations in advance.
- Bayesian updating adjusts confidence to evidence; quarterly reviews close the planning loop.
- Capacity planning
- Matching planned work to the real hours available.
- Planning fallacy
- The tendency to underestimate how long tasks will take.
- Buffer
- Unscheduled time kept free to absorb delays and opportunities.
- Roadmap
- A high-level plan of major work and milestones over time.
- Scenario planning
- Preparing for several possible futures rather than one forecast.
- Base case
- The most likely scenario used for planning.
- Pre-mortem
- An exercise imagining a plan has failed to identify causes in advance.
- Prior
- A belief held before new evidence is considered.
- Bayesian updating
- Revising a belief in proportion to how strongly new evidence supports it.
- Quarterly review
- A structured look back at the last quarter before planning the next.
Practice problems
Work each problem on paper first, then reveal the answer to check.
Name the three layers of the planning cycle.
Show answer
Annual, quarterly, and monthly or weekly.
A creator has 30 production hours a week for 12 weeks; videos take 20 hours. How many videos fit?
Show answer
18.
What is the planning fallacy?
Show answer
Underestimating how long tasks will take.
Recent videos took 15, 18, 20, 22 and 30 hours. What is the median?
Show answer
20 hours.
What buffer is often recommended?
Show answer
About 15 to 25 % of capacity.
Why plan multiple scenarios?
Show answer
To avoid overconfidence and prepare actions for different futures.
Income $6,000 base; sponsorships of $3,000 fall 40 % in the downside. What is downside income?
Show answer
$4,800.
What is a pre-mortem?
Show answer
Imagining the plan has failed and listing why.
Prior 20 %; evidence is twice as likely if successful (0.6 vs 0.3). What is the posterior?
Show answer
0.12 ÷ (0.12 + 0.24) ≈ 33 %.
List the four questions of a quarterly review.
Show answer
Planned versus actual; what we learned; surprises; start, stop, continue.
Lesson quiz · 5 questions
Score 60% or more to complete this lesson.
Create a free account to save your progress, take quizzes and earn a certificate.