
CRE-440 · Lesson 6 of 12 · 36 min
Statistics for noisy results
Creator data is noisy. Two similar videos published a week apart can differ in views by a factor of three for no identifiable reason. A thumbnail test can show one version ahead on Monday and behind on Wednesday. Without some statistics, it is impossible to tell whether an apparent improvement is real or just a lucky draw. This lesson introduces the core ideas needed to read experiment results honestly: variation and averages, confidence intervals, statistical significance, sample size and power, and the problem of multiple comparisons. The maths is kept to what a creator can do with a calculator or spreadsheet, and the emphasis is on judgment rather than formulas.
Variation and why averages can mislead
Every metric varies from video to video. Some of that variation comes from things you control, such as topic and packaging, and some from things you do not, such as competing uploads, news events and the platform's testing of your content with different audiences. Statisticians call the uncontrolled part noise. The more noise there is, the harder it is to detect the effect of a change.
View counts are especially tricky because they are skewed: most videos cluster around a typical level, while an occasional video takes off and gets many times more. A single viral hit can pull the average up dramatically. For this reason, creators often use the median, the middle value when results are sorted, as a more stable summary of typical performance.
Worked problem
Mean versus median
Seven videos earned first-week views of 8,000, 9,500, 10,000, 11,000, 12,000, 12,500 and 95,000. Compare the mean and median.
Show solution
- Sum: 8,000 + 9,500 + 10,000 + 11,000 + 12,000 + 12,500 + 95,000 = 158,000.
- Mean: 158,000 ÷ 7 ≈ 22,571.
- Median: the middle (fourth) value when sorted, which is 11,000.
Answer: The mean of about 22,600 is more than double the median of 11,000 because of one viral video. The median better represents a typical video, so it is a better baseline for judging whether a change helped.
Spread is measured by the standard deviation, which describes how far results typically fall from the average. A channel whose videos all land within a few thousand views of each other has a small standard deviation; one with big hits and misses has a large one. Spreadsheets calculate it with a single function, such as STDEV.
Two kinds of experiment data
Experiment results usually come in one of two forms, and the statistics differ slightly.
- Proportions from many viewers: click-through rate, the share who watch past 30 seconds, the share who subscribe. Here the sample size is the number of impressions or viewers, often thousands, which gives a lot of statistical power.
- Averages across videos: average views per video, average percentage viewed per video. Here the sample size is the number of videos, often only a handful, which gives much less power, because each video brings its own topic and timing.
This distinction explains why packaging tests on a single video can be conclusive within days, while tests that compare groups of videos often need months.
Confidence intervals
A confidence interval gives a range of plausible values for a true rate or effect, based on the data. A 95 % confidence interval is constructed so that, if you repeated the experiment many times, about 95 % of such intervals would contain the true value. For a proportion such as click-through rate, an approximate 95 % interval is the observed rate plus or minus 1.96 standard errors.
Worked problem
A confidence interval for click-through rate
A thumbnail earned a 5.0 % click-through rate on 50,000 impressions. What is the approximate 95 % confidence interval?
Show solution
- Standard error: \( \sqrt{0.05 \times 0.95 \div 50{,}000} = \sqrt{0.00000095} \approx 0.000975 \), or 0.0975 percentage points.
- Margin: 1.96 × 0.0975 ≈ 0.19 percentage points.
- Interval: 5.0 % ± 0.19 points, or about 4.81 % to 5.19 %.
Answer: The true click-through rate is plausibly between about 4.8 % and 5.2 %. With 5,000 impressions instead, the margin would be about three times wider, roughly ± 0.6 points, because the margin shrinks with the square root of the sample size.
If confidence intervals for two versions overlap heavily, the data cannot clearly separate them. If they do not overlap at all, the difference is very likely real. Partial overlap needs a direct test of the difference, shown next.
Statistical significance
A significance test asks how surprising the observed difference would be if there were really no difference between versions. That assumption of no difference is called the null hypothesis. The test produces a p-value: the probability of seeing a difference at least this large by chance alone if the null hypothesis were true. By convention, a p-value below 0.05 is called statistically significant. For comparing two proportions, a z-test works well when samples are large.
Here \( \bar{p} \) is the pooled rate across both versions. A z value larger than about 1.96 in either direction corresponds to a two-sided p-value below 0.05.
Worked problem
A two-proportion z-test
Thumbnail A: 1,000 clicks on 20,000 impressions (5.0 %). Thumbnail B: 1,100 clicks on 20,000 impressions (5.5 %). Is the difference statistically significant at the 5 % level?
Show solution
- Pooled rate: (1,000 + 1,100) ÷ 40,000 = 0.0525.
- Standard error: \( \sqrt{0.0525 \times 0.9475 \times (1/20{,}000 + 1/20{,}000)} = \sqrt{0.0000049744} \approx 0.00223 \).
- Difference: 0.055 − 0.050 = 0.005.
- z = 0.005 ÷ 0.00223 ≈ 2.24, which is larger than 1.96.
Answer: Yes. With z ≈ 2.24, the two-sided p-value is about 0.025, below 0.05. Thumbnail B's higher click-through rate is unlikely to be pure chance, though the creator should still check watch time as a guardrail.
Significance is not the same as importance. With huge samples, tiny and unimportant differences can be significant; with small samples, important differences can fail to reach significance. Always look at the size of the effect and its confidence interval, not just whether p is below 0.05.
Comparing averages across a few videos
When the unit of comparison is the video, the sample is small and noise is large. A rough approach uses the standard error of the difference between two group means.
Worked problem
Is a six-video holdout result convincing?
In lesson 5's end-screen test, the playlist group averaged 11.4 minutes of session watch time per view and the standard group 9.8 minutes, with six videos each. Suppose the standard deviation within each group is 2.0 minutes. Estimate the 95 % interval for the difference.
Show solution
- Standard error: \( \sqrt{2.0^2/6 + 2.0^2/6} = \sqrt{1.333} \approx 1.15 \) minutes.
- With only 12 videos, use a slightly larger multiplier than 1.96; for 10 degrees of freedom it is about 2.23.
- Margin: 2.23 × 1.15 ≈ 2.57 minutes.
- Interval: 1.6 ± 2.57, or about −1.0 to +4.2 minutes.
Answer: The interval includes zero, so six videos per group cannot rule out no effect, even though the estimate looks promising. The creator should extend the test or treat the result as encouraging but unproven.
Sample size and power
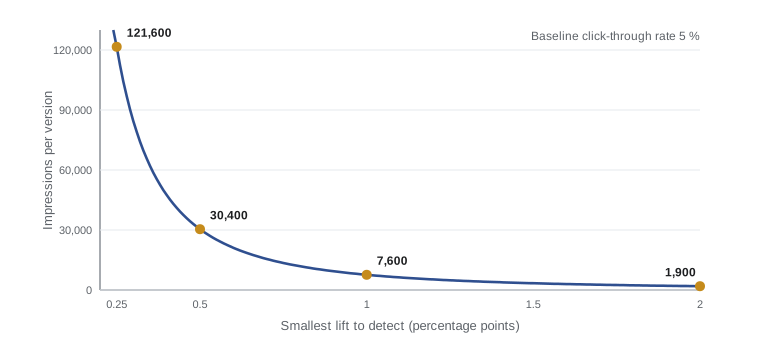
Statistical power is the probability that an experiment detects an effect of a given size if it truly exists. Underpowered experiments are common for creators: they run too briefly, conclude nothing has an effect, and abandon good ideas. Before running a test, estimate how much data you need. A widely used approximation for about 80 % power at the 5 % significance level gives the sample size per group as roughly 16 times the variance divided by the square of the smallest effect worth detecting.
Worked problem
Impressions needed for a thumbnail test
A creator's click-through rate is about 5 %. They want to detect an improvement of 0.5 percentage points. Roughly how many impressions are needed per thumbnail?
Show solution
- Variance for a proportion: p(1 − p) = 0.05 × 0.95 = 0.0475.
- Smallest effect: δ = 0.005, so δ² = 0.000025.
- n ≈ 16 × 0.0475 ÷ 0.000025 = 0.76 ÷ 0.000025 = 30,400.
Answer: About 30,000 impressions per thumbnail. A video with 60,000 impressions in its test period can detect a 0.5-point lift between two versions; a smaller video should aim to detect only larger effects or test longer.
Worked problem
Videos needed for a holdout
For the end-screen test, the standard deviation is 2.0 minutes and the creator wants to detect a 1.6-minute difference. How many videos per group are needed?
Show solution
- n ≈ 16 × 2.0² ÷ 1.6² = 16 × 4 ÷ 2.56 = 25.
Answer: About 25 videos per group, around 50 in total. For a weekly uploader, that is about a year, which is why video-level tests should focus on changes expected to have large effects, or be combined with stronger designs.
Multiple comparisons
Each significance test at the 5 % level has a 5 % chance of a false positive, a result that looks significant by luck. If you test many metrics, segments or versions, false positives accumulate. With 10 independent tests and no real effects, the chance of at least one false positive is 1 − 0.95¹⁰ ≈ 40 %. Creators commonly fall into this trap by slicing results many ways, by country, device, traffic source and age group, and reporting whichever slice looks best. Remedies include choosing one primary metric in advance, treating other comparisons as exploratory, and, when several tests must be judged together, using a stricter threshold such as the Bonferroni correction, which divides 0.05 by the number of tests.
Worked problem
How likely is a false positive?
A creator checks a test result across 8 segments, each at the 5 % level, when in truth there is no effect. What is the chance at least one segment looks significant, and what Bonferroni threshold would protect against this?
Show solution
- Chance no segment is significant: 0.95⁸ ≈ 0.663.
- Chance at least one is significant: 1 − 0.663 ≈ 0.337, or about 34 %.
- Bonferroni threshold: 0.05 ÷ 8 = 0.00625.
Answer: There is about a one-in-three chance of a spurious win. Requiring p below about 0.006 for each segment keeps the overall false-positive risk near 5 %.
Peeking and stopping rules
Checking results repeatedly and stopping as soon as they look significant, called peeking, also inflates false positives, because random fluctuations cross the threshold at some point surprisingly often. Decide the sample size or duration in advance and judge the result then. Platforms' own testing tools manage this internally, which is one reason to prefer them when available.
A practical checklist
- Use medians or watch time rather than raw view averages when hits are skewed.
- Estimate the needed sample size before testing.
- Report effect sizes with confidence intervals, not just significance.
- Choose one primary metric and avoid slicing results many ways.
- Do not stop early because results look good; stick to the plan.
- Treat a single significant result as evidence, not proof, and confirm important findings with a repeat test.
Common mistakes
MistakeUsing mean views when one viral video dominates.
InsteadUse the median or a trimmed average, or a less skewed metric such as watch time per view.
MistakeConcluding "no effect" from a tiny test.
InsteadEstimate power in advance; a small test can miss real effects.
MistakeTreating statistical significance as importance.
InsteadLook at the effect size and its confidence interval.
MistakeSlicing results by many segments and reporting the best.
InsteadPre-choose the primary comparison and correct for multiple tests.
MistakeStopping a test the moment it looks significant.
InsteadDecide the duration or sample size in advance and judge at the end.
Summary and key terms
- Creator metrics are noisy and view counts are skewed, so medians are often better baselines than means.
- Proportion tests across many viewers have much more power than comparisons across a few videos.
- A 95 % confidence interval for a proportion is about p ± 1.96 √(p(1 − p)/n).
- A two-proportion z-test compares rates; |z| above about 1.96 means p below 0.05.
- Significance is not importance: report effect sizes with intervals.
- Sample size per group is roughly 16 × variance ÷ effect²; small effects need very large samples.
- Multiple comparisons and peeking inflate false positives; pre-commit and correct.
- Noise
- Variation in results caused by uncontrolled factors.
- Median
- The middle value when results are sorted; robust to extreme values.
- Standard deviation
- A measure of how far results typically fall from the average.
- Confidence interval
- A range of plausible values for a true rate or effect.
- Null hypothesis
- The assumption that there is no real difference between versions.
- p-value
- The probability of a difference at least as large as observed if the null hypothesis were true.
- Statistical significance
- A result unlikely to occur by chance under the null hypothesis, conventionally p below 0.05.
- Statistical power
- The probability that a test detects an effect of a given size if it exists.
- False positive
- A result that appears significant by chance when there is no real effect.
- Bonferroni correction
- Dividing the significance threshold by the number of tests to control false positives.
Practice problems
Work each problem on paper first, then reveal the answer to check.
Views: 5,000, 6,000, 6,500, 7,000, 60,000. What are the mean and median?
Show answer
Mean 16,900; median 6,500.
Why do proportion tests have more power than video-level tests?
Show answer
They use thousands of viewers as the sample instead of a handful of videos.
CTR is 4 % on 40,000 impressions. What is the 95 % margin?
Show answer
1.96 × √(0.04 × 0.96 ÷ 40,000) ≈ 0.19 points.
What does a p-value of 0.03 mean?
Show answer
If there were no real difference, a result this large would occur about 3 % of the time.
A z value is 1.5. Is the result significant at 5 %?
Show answer
No; it is below 1.96.
Baseline CTR 6 %; detect 1 point. Roughly how many impressions per version?
Show answer
16 × 0.06 × 0.94 ÷ 0.0001 ≈ 9,000.
SD 3 minutes; detect 2 minutes. How many videos per group?
Show answer
16 × 9 ÷ 4 = 36.
Chance of at least one false positive in 5 tests at 5 %?
Show answer
1 − 0.95⁵ ≈ 23 %.
Bonferroni threshold for 4 tests?
Show answer
0.0125.
What is peeking?
Show answer
Checking repeatedly and stopping as soon as results look significant.
Lesson quiz · 5 questions
Score 60% or more to complete this lesson.
Create a free account to save your progress, take quizzes and earn a certificate.