
CMPUT-401 · Lesson 9 of 12 · 31 min
Operating products: SLOs, incidents and technical debt
A product is not finished when it launches; launch is when its real life begins. Driftwood's app must be available at 6:30 on a winter morning when a storm cancels sailings, and it must keep working as the team adds features. This lesson covers three parts of operating a product: setting reliability targets with service level objectives and error budgets, handling incidents and learning from them, and managing technical debt so the product stays changeable. For the broader IT service management framework, including service desks, change enablement and problem management, see ITIL-140; this lesson focuses on the product team's decisions.
SLIs, SLOs and SLAs
Google's site reliability engineering (SRE) practice gave product teams a vocabulary for reliability. A service level indicator (SLI) is a measurement of some aspect of service quality, usually expressed as the proportion of good events: for example, the share of schedule page requests that succeed and load in under one second. A service level objective (SLO) is a target for an SLI over a period: 99.9 per cent of requests good over a rolling 30 days. A service level agreement (SLA) is a contract with consequences, such as service credits, if a level is missed; SLAs are usually looser than internal SLOs so the team has warning before a contractual breach.
Good SLIs measure what users experience, not what is easy to measure. CPU utilization is not an SLI; users do not care about CPU. The proportion of successful, fast responses at the load balancer, or better still in the browser, is closer. Each important user journey can have its own SLIs: for Driftwood, loading the schedule, seeing the delay banner, and receiving a capacity alert within two minutes. A small number of well-chosen SLOs is better than dozens nobody watches.
Error budgets
No service is 100 per cent reliable, and trying to be is very expensive and slows change to a crawl. An error budget turns the SLO into a resource: if the SLO is 99.9 per cent, the team may spend 0.1 per cent of the period being unreliable. Over an average month of about 43,830 minutes, that is about 43.8 minutes of full outage, or the equivalent in partial failures. Each additional nine cuts the budget tenfold, and costs rise steeply, so the right SLO is the lowest level that keeps users happy, not the highest achievable.
# Error budgets: how much unreliability does an availability SLO allow?
minutes_per_month = 365.25 / 12 * 24 * 60      # average month, about 43,830 minutes
for slo in (0.99, 0.995, 0.999, 0.9995, 0.9999):
    budget = (1 - slo) * minutes_per_month
    print(f"SLO {slo:.2%}: error budget {budget:7.1f} minutes per month "
f"({budget / 60:5.2f} h)")SLO 99.00%: error budget 438.3 minutes per month ( 7.31 h) SLO 99.50%: error budget 219.2 minutes per month ( 3.65 h) SLO 99.90%: error budget 43.8 minutes per month ( 0.73 h) SLO 99.95%: error budget 21.9 minutes per month ( 0.37 h) SLO 99.99%: error budget 4.4 minutes per month ( 0.07 h)
Error budgets settle an old argument between developers who want to ship and operators who want stability. While budget remains, the team ships freely. If the budget is exhausted, the agreed policy applies: for example, a feature freeze except for reliability work until the SLI recovers. The policy is agreed in advance with the client and the team, so nobody argues about it in the middle of a crisis. For a product manager, the error budget is a prioritization tool: a budget repeatedly overspent is a signal to move reliability work up the backlog.
Request-based SLIs count good and bad events directly. The code simulates a month of morning-peak requests to the schedule page, including a 40-minute incident, and checks the result against a 99.9 per cent SLO.
# Compute a request-based SLI from (invented) request logs and check the budget.
import random
random.seed(401)
# one month of morning-peak traffic: (status, latency_ms) per request
requests = []
for _ in range(400_000):
    status = 500 if random.random() < 0.0002 else 200
    latency = random.lognormvariate(5.3, 0.4)   # median about 200 ms
    requests.append((status, latency))
# a 40-minute incident: many slow or failing requests
for _ in range(200):
    requests.append((503 if random.random() < 0.5 else 200, random.uniform(2000, 9000)))
good = sum(1 for s, ms in requests if s < 500 and ms < 1000)
sli = good / len(requests)
slo = 0.999
allowed_bad = (1 - slo) * len(requests)
bad = len(requests) - good
print(f"requests {len(requests)}, good {good}, SLI {sli:.4%}")
print(f"SLO {slo:.1%}: allowed bad {allowed_bad:.0f}, actual bad {bad}, "
f"budget used {bad / allowed_bad:.0%}")requests 400200, good 399913, SLI 99.9283% SLO 99.9%: allowed bad 400, actual bad 287, budget used 72%
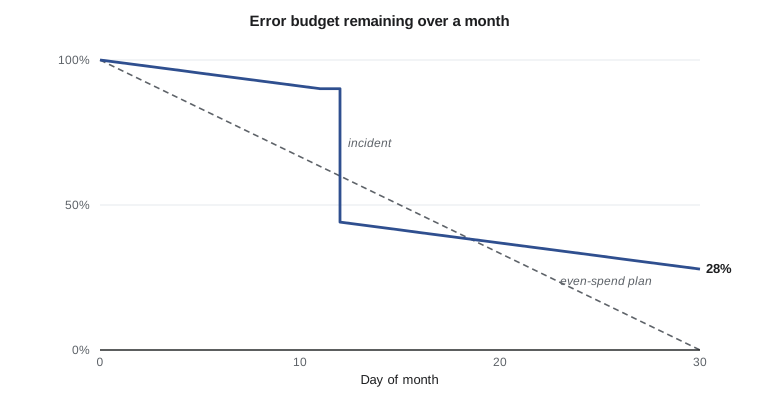
The month met its objective despite the incident, but used a large share of its budget. That should prompt a conversation: is the remaining budget enough for the planned release of capacity alerts? Teams watch budget consumption continuously using burn rate, the speed at which the budget is being spent relative to plan. A burn rate of 1 uses exactly the month's budget in a month; a burn rate of 14.4 sustained for an hour uses 2 per cent of a 30-day budget, a common threshold for paging someone immediately in the Google SRE Workbook's multi-window approach.
# Burn-rate alerting: page when the budget is being spent much faster than planned.
# A burn rate of 1 spends exactly the month's budget in a month.
slo = 0.999
budget_fraction = 1 - slo
windows = [  # (label, window hours, observed error fraction in that window)
    ("normal hour", 1, 0.0005),
    ("bad hour", 1, 0.02),
    ("slow leak, 6 h", 6, 0.004),
]
hours_in_month = 730
for label, hours, err in windows:
    burn = err / budget_fraction
    spent = burn * hours / hours_in_month
    page = burn >= 14.4      # a common fast-burn threshold for a 1-hour window
    ticket = 6 <= burn < 14.4 or (burn >= 3 and hours >= 6)
    action = "PAGE on-call" if page else "open ticket" if ticket else "no action"
print(f"{label:15s} burn rate {burn:5.1f} spends {spent:6.1%} of budget -> {action}")normal hour burn rate 0.5 spends 0.1% of budget -> no action bad hour burn rate 20.0 spends 2.7% of budget -> PAGE on-call slow leak, 6 h burn rate 4.0 spends 3.3% of budget -> open ticket
Incidents and on-call
An incident is an unplanned disruption or degradation of service that needs a response. Good incident response has defined roles. An incident commander coordinates and makes decisions but does not debug; an operations lead investigates and fixes; a communications lead updates stakeholders and users. In a small team one person may hold several roles, but naming them avoids the classic failure where everyone debugs and nobody tells the client what is happening. Driftwood's office staff need to know within minutes if the delay banner is wrong, because they are fielding the calls.
Severity levels set expectations: for example, SEV1 means a core journey is down for many users and the team responds immediately at any hour; SEV2 means a major degradation; SEV3 means a minor issue handled in working hours. The first goal of response is to mitigate, by rolling back, turning off a flag or failing over, and only then to find the root cause. Restoring service quickly matters more to users than a perfect diagnosis.
Someone must be reachable when things break. An on-call rotation shares that duty across the team, with clear escalation paths and handover notes. Sustainable on-call matters for people and for reliability: alerts must be actionable (every page should require human action), rotations should be long enough to rest between shifts, and on-call work outside normal hours should be compensated under the employer's policy and applicable employment standards. For a client project like Driftwood, the contract must say who is on call after handover: Team Lumen, Driftwood's IT contractor, or nobody outside business hours. Leaving this unstated is a common and serious gap.
Blameless postmortems
After a significant incident, the team writes a postmortem (also called an incident review): a document describing what happened, the impact, the timeline, contributing factors, what went well, what went badly and action items with owners. The SRE tradition, and safety science before it, emphasizes blamelessness: the review focuses on how the system, including processes, tools and incentives, allowed the failure, rather than on who made a mistake. People who fear blame hide information, and hidden information means the same failure happens again. Blameless does not mean accountability-free; it means accountability for improving the system.
Action items must be tracked to completion in the product backlog alongside features, which is where the PM matters. A postmortem whose actions never get prioritized is theatre. Many teams review postmortem action items in the same meeting as the error budget, so reliability work competes for capacity openly rather than being forgotten.
Technical debt
Ward Cunningham coined the technical debt metaphor in 1992: shipping code that is not quite right is like borrowing money. It can be a sensible way to move fast, but the debt accrues interest, paid as extra effort every time someone works in that code, until the principal is repaid by refactoring. The metaphor is valuable precisely because it speaks to clients and managers: it explains why a team that never pays down debt gradually slows down, and why some refactoring is a business investment, not engineering perfectionism.
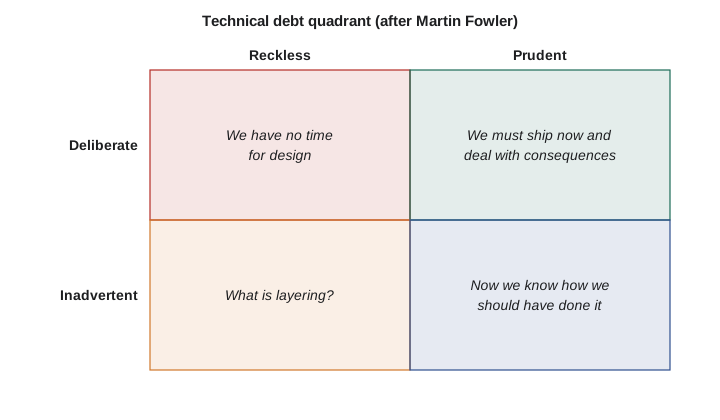
Martin Fowler's technical debt quadrant distinguishes debt along two axes: deliberate versus inadvertent, and prudent versus reckless. Prudent deliberate debt is a conscious trade-off, such as we must ship the delay banner before the storm season and will clean up the data layer afterwards. Reckless deliberate debt is we have no time for design. Reckless inadvertent debt comes from not knowing better. Prudent inadvertent debt is now we know how we should have done it, which arises in every good team as it learns. Only some of this debt is a choice, but all of it needs managing.
The interest analogy can be modelled. The simulation below compares two teams that start with the same debt. One spends all capacity on features; the other reserves 20 per cent for refactoring. The model is illustrative, and the drag and repayment constants are invented, but its shape matches what many teams experience: the no-refactoring team starts faster, then slows as debt accumulates, and over several months delivers less in total.
# Technical debt as interest: compare a team that never pays down debt with one that
# spends 20% of capacity on refactoring (illustrative model, not a law of nature).
def simulate(refactor_share, sprints=16, capacity=20.0):
    debt, out = 10.0, []
    for _ in range(sprints):
        drag = min(0.6, debt / 100)           # each debt unit slows work by 1%
        effective = capacity * (1 - drag)
        features = effective * (1 - refactor_share)
        debt += 0.25 * features               # new work adds some debt
        debt -= 1.5 * effective * refactor_share   # refactoring removes debt
        debt = max(debt, 0.0)
        out.append(features)
    return out
a, b = simulate(0.0), simulate(0.2)
print("sprint  no-refactor  20%-refactor")
for i in (0, 3, 7, 11, 15):
    print(f"{i + 1:6d}  {a[i]:11.1f}  {b[i]:12.1f}")
print(f"total {sum(a):11.1f} {sum(b):12.1f}")sprint no-refactor 20%-refactor
1 18.0 14.4
4 15.4 15.3
8 12.6 16.0
12 10.2 16.0
16 8.3 16.0
total 201.6 250.8Managing debt is a product decision. Practical approaches include keeping a visible debt register in the backlog with each item's estimated interest (how often it slows work and by how much); reserving a fixed share of capacity, often 10 to 20 per cent, for refactoring and maintenance; paying down debt in code that is about to change for a feature anyway; and accepting debt deliberately only with a written repayment plan. Old feature flags (lesson 7), outdated dependencies with known vulnerabilities and missing tests on high-risk areas (lesson 8) are typical Driftwood debt items.
Worked examples
Worked problem
Computing an error budget
What is the monthly error budget in minutes for a 99.9 per cent availability SLO?
Show solution
- An average month has 365.25 / 12 = 30.44 days, so 30.44 times 24 times 60 = 43,830 minutes.
- Budget = 0.001 times 43,830 = 43.8 minutes.
Answer: About 43.8 minutes per month, matching the code.
Worked problem
Interpreting a burn rate
In one hour, 2 per cent of requests fail against a 99.9 per cent SLO. What is the burn rate and how much budget is spent?
Show solution
- Burn rate = 0.02 / 0.001 = 20.
- Budget spent = 20 times 1 / 730 hours = 2.7 per cent of the month's budget in one hour.
- Burn rate 20 exceeds 14.4, so page on-call.
Answer: Burn rate 20; about 2.7 per cent of the budget gone in an hour; page immediately.
Worked problem
Classifying debt
Team Lumen hard-coded the summer timetable to meet a deadline, writing a ticket to replace it with the import before autumn. Classify the debt.
Show solution
- They knew they were taking a shortcut: deliberate.
- They weighed the trade-off and planned repayment: prudent.
Answer: Prudent deliberate debt, as long as the repayment ticket is prioritized before the timetable changes.
Common mistakes
MistakeAim for 100 per cent availability.
InsteadChoose the lowest SLO that keeps users happy; each extra nine costs far more and slows change.
MistakeUse CPU or memory as an SLI.
InsteadSLIs should measure user experience, such as successful fast responses.
MistakeDuring an incident, find the root cause before doing anything else.
InsteadMitigate first by rolling back or turning off a flag, then investigate.
MistakeA postmortem should identify who caused the incident.
InsteadBlameless postmortems examine how the system allowed failure and assign improvement actions.
MistakeTechnical debt is always bad engineering.
InsteadPrudent deliberate debt can be a sound trade-off if it is tracked and repaid.
Summary and key terms
- SLIs measure user-facing quality; SLOs set targets; SLAs are contracts.
- The error budget is 1 minus the SLO; 99.9 per cent allows about 43.8 minutes a month.
- Error budget policies balance shipping speed against reliability.
- Burn-rate alerts page for fast budget consumption and ticket slow leaks.
- Incident response has roles and mitigates before diagnosing.
- Blameless postmortems produce tracked action items.
- Technical debt accrues interest; manage it with a register and a refactoring budget.
- Service level indicator
- A measured proportion of good events reflecting user experience.
- Service level objective
- A target value for an SLI over a time window.
- Service level agreement
- A contract specifying service levels and consequences.
- Error budget
- The allowed unreliability implied by an SLO.
- Burn rate
- How fast the error budget is consumed relative to plan.
- Incident commander
- The person who coordinates incident response and makes decisions.
- On-call rotation
- A schedule sharing responsibility for responding to incidents.
- Blameless postmortem
- An incident review focusing on system causes rather than individual fault.
- Technical debt
- The future cost of shortcuts or outdated design in code.
- Technical debt quadrant
- Fowler's classification of debt as reckless or prudent, deliberate or inadvertent.
Practice problems
Work each problem on paper first, then reveal the answer to check.
What is the difference between an SLO and an SLA?
Show answer
An SLO is an internal target; an SLA is a contract with consequences.
What is the monthly error budget for 99.99 per cent?
Show answer
About 4.4 minutes.
Give an SLI for Driftwood's capacity alerts.
Show answer
Share of alerts delivered within two minutes.
What share of budget did the SLI simulation use?
Show answer
About 72 per cent: within the SLO, but with little room left.
What does a burn rate of 1 mean?
Show answer
The budget would be used up exactly at the end of the period.
Name the three incident roles.
Show answer
Incident commander, operations lead and communications lead.
What is the first goal of incident response?
Show answer
Mitigate and restore service.
List three postmortem sections.
Show answer
Any three of summary, impact, timeline, contributing factors, what went well, action items.
In the debt simulation, which team delivered more in total?
Show answer
The team reserving 20 per cent for refactoring.
Give an example of prudent inadvertent debt.
Show answer
Realizing after launch how the data model should have been designed.
Lesson quiz · 5 questions
Score 60% or more to complete this lesson.
Create a free account to save your progress, take quizzes and earn a certificate.