
CMPUT-401 · Lesson 10 of 12 · 32 min
Product metrics and analytics
Lessons 5 and 9 measured experiments and reliability. This lesson is about measuring the product itself: whether people find it, use it, keep using it and get value from it, and whether it makes economic sense. Good metrics help a team see whether it is achieving its outcomes; bad metrics mislead it, reward the wrong behaviour or become targets that stop meaning anything. We cover choosing a North Star metric, the AARRR funnel, retention cohorts, engagement ratios, churn and lifetime value, Google's HEART framework, and the economics of pricing a software product. For deeper treatment of financial analysis, see BUS-450; for statistics, see STAT-151.
North Star metrics
A North Star metric is a single measure that best captures the core value a product delivers to customers, chosen so that if it grows sustainably, the business succeeds. Examples often cited include nights booked for a short-term rental marketplace and weekly active listeners for a music service. A good North Star measures value received by users, not revenue or vanity; is a leading indicator of business results; and can be influenced by the team's work. For Driftwood, Team Lumen proposed trips planned with confidence per week: the number of travellers who checked the schedule or capacity before a sailing and then boarded it.
A North Star is supported by input metrics: the few drivers the team can move directly, such as the share of visitors who find the next sailing within ten seconds, alert subscribers, and accuracy of the capacity estimate. Input metrics connect daily work to the North Star and form the key results in OKRs (lesson 6). Teams should also choose counter-metrics that would reveal harm from chasing the North Star too hard, such as phone calls to the office or complaints about alert frequency.
Vanity metrics and Goodhart's law
Vanity metrics look good but do not inform decisions: total registered users, cumulative downloads, raw page views. They only go up and say nothing about whether people get value. Actionable metrics, by contrast, are tied to specific behaviours and can show whether a change helped. Even good metrics degrade when turned into targets, an observation known as Goodhart's law: when a measure becomes a target, it ceases to be a good measure. If Team Lumen were rewarded for alert subscribers, they could pre-check the subscription box, which would raise the number while annoying users and possibly breaching consent rules (lesson 12). Pair every target with counter-metrics and human judgement.
The AARRR funnel
Dave McClure's pirate metrics, AARRR, describe a customer life cycle in five stages: acquisition (people arrive), activation (they have a first good experience), retention (they come back), referral (they tell others) and revenue (they pay). Each stage has a conversion rate from the one before. Funnels show where the biggest losses are, which tells the team where to focus. Some versions add awareness at the top, and the order of retention and referral is sometimes swapped; the value is in the stage-by-stage view.
# AARRR funnel for Driftwood's capacity-alert feature (invented monthly counts).
stages = [
    ("Acquisition: visited site",          24000),
    ("Activation: viewed a sailing",       15600),
    ("Activation+: subscribed to alerts",   2340),
    ("Retention: still subscribed at 30 d", 1640),
    ("Referral: shared a sailing link",      410),
    ("Revenue: bought a commuter pass",      120),
]
prev = None
for name, n in stages:
    step = f"{n / prev:6.1%} of previous" if prev else ""
    print(f"{name:38s}{n:7d}  {n / stages[0][1]:6.1%} of top  {step}")
prev = nAcquisition: visited site 24000 100.0% of top Activation: viewed a sailing 15600 65.0% of top 65.0% of previous Activation+: subscribed to alerts 2340 9.8% of top 15.0% of previous Retention: still subscribed at 30 d 1640 6.8% of top 70.1% of previous Referral: shared a sailing link 410 1.7% of top 25.0% of previous Revenue: bought a commuter pass 120 0.5% of top 29.3% of previous
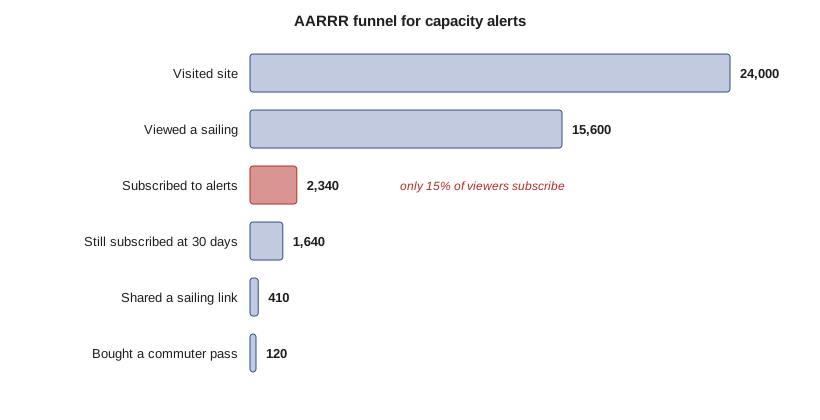
The largest proportional drop is from viewing a sailing to subscribing: only 15 per cent of activated visitors subscribe. That suggests the team should test how and when the subscription is offered, as in lesson 5's sign-up prompt experiment, before spending on acquisition. Pouring more visitors into a leaky funnel wastes money. Funnel definitions must be precise and stable: what counts as activation, over what time window, and whether a person is counted once or per visit.
Retention and cohorts
Retention is often the most important product metric, because a product that people do not come back to will not survive however well it acquires users. Averages hide retention problems, since new sign-ups mask departures. Cohort analysis groups users by when they started, for example by sign-up week, and tracks what share of each cohort is still active in later periods. Reading down a column compares cohorts at the same age, showing whether the product is improving; reading across a row shows how one cohort decays over time.
# A weekly retention cohort table built from (invented) activity events.
import random
from collections import defaultdict
random.seed(401)
signups = {}            # user -> signup week
active = defaultdict(set)
uid = 0
for week in range(6):
    for _ in range(200 + 40 * week):         # growing signups each week
        uid += 1
        signups[uid] = week
        keep = 0.55 if week < 3 else 0.68     # onboarding fix shipped in week 3
        w = week
        while w < 6:
            active[w].add(uid)
            w += 1
            if random.random() > keep:
                break
            keep = min(0.92, keep + 0.12)      # survivors become habitual
print("cohort  size   " + "  ".join(f"wk{k}" for k in range(6)))
for c in range(6):
    members = [u for u, w in signups.items() if w == c]
    cells = []
    for k in range(6 - c):
        r = sum(u in active[c + k] for u in members) / len(members)
        cells.append(f"{r:4.0%}")
print(f" {c} {len(members):4d} " + " ".join(cells))cohort size wk0 wk1 wk2 wk3 wk4 wk5 0 200 100% 60% 37% 26% 23% 20% 1 240 100% 55% 37% 27% 24% 2 280 100% 48% 34% 26% 3 320 100% 69% 54% 4 360 100% 68% 5 400 100%
The table shows the classic retention curve: a steep drop after the first week, then flattening as remaining users form a habit. A curve that flattens above zero indicates product-market fit for that group; a curve that keeps falling to zero indicates a product people try but abandon. The cohorts from week 3 onward retain noticeably better at week 1, which is evidence that the onboarding fix worked, something a single overall active-user number would not have shown. For seasonal products like Driftwood, compare cohorts from comparable seasons: summer tourists naturally churn after their trip, while commuters should not.
Engagement: DAU/MAU
Engagement ratios measure how often people use a product. Daily active users divided by monthly active users (DAU/MAU) is a common stickiness measure: it approximates the share of days in a month that a typical monthly user is active. Social apps aim high; many utility products are far lower and fine. What matters is the right frequency for the job. A commuter should check the ferry app on workdays; a tourist once or twice. Blending them produces a meaningless average, so segment the ratio.
# DAU/MAU stickiness from a month of (invented) daily active user sets.
import random
random.seed(401)
commuters = [f"c{i}" for i in range(600)]     # check most weekdays
visitors = [f"v{i}" for i in range(3000)]     # check once or twice
daily = []
for day in range(30):
    weekday = day % 7 < 5
    users = {u for u in commuters if random.random() < (0.7 if weekday else 0.15)}
    users |= {u for u in visitors if random.random() < 0.04}
    daily.append(users)
mau = len(set().union(*daily))
avg_dau = sum(len(d) for d in daily) / len(daily)
print(f"average DAU {avg_dau:.0f}, MAU {mau}, DAU/MAU {avg_dau / mau:.0%}")average DAU 452, MAU 2735, DAU/MAU 17%
The overall ratio is low because thousands of occasional visitors count in MAU but rarely appear in DAU. Computed only for commuters, the ratio would be far higher. The lesson is general: define active meaningfully (opened the app is weaker than checked a sailing) and segment by user type before drawing conclusions.
HEART
Google's HEART framework, published by Kerry Rodden, Hilary Hutchinson and Xin Fu in 2010, offers five categories of user-centred metrics: happiness (attitudes, such as satisfaction surveys), engagement (depth and frequency of use), adoption (new users of a product or feature), retention (users who return) and task success (efficiency, effectiveness and error rate). It pairs with a goals-signals-metrics process: state the goal for each category, identify signals that would show progress, then define metrics. HEART reminds teams that analytics are not only funnel counts; task success and happiness capture whether the product is pleasant and effective to use.
Churn, lifetime value and unit economics
For products that charge subscriptions, three numbers dominate. Churn is the share of customers who leave in a period. Lifetime value (LTV) is the expected gross profit from a customer over their relationship; a simple formula with constant monthly churn is monthly revenue per customer times gross margin divided by monthly churn. Customer acquisition cost (CAC) is the sales and marketing spending needed to gain one customer. A commonly cited rule of thumb in SaaS is an LTV to CAC ratio of at least 3 and a CAC payback period of under about 12 months, although the right values depend on the business and its funding.
# Unit economics for a commuter-pass subscription (illustrative numbers).
price = 12.00          # per month
gross_margin = 0.80    # after SMS, payment fees and hosting
monthly_churn = 0.06   # 6% of subscribers cancel each month
cac = 45.00            # marketing cost to acquire one paying subscriber
lifetime_months = 1 / monthly_churn
ltv = price * gross_margin * lifetime_months
payback = cac / (price * gross_margin)
print(f"expected lifetime {lifetime_months:.1f} months")
print(f"LTV {ltv:.2f}, CAC {cac:.2f}, LTV/CAC {ltv / cac:.1f}")
print(f"CAC payback {payback:.1f} months")
for churn in (0.03, 0.06, 0.10):
print(f" churn {churn:.0%}: LTV {price * gross_margin / churn:7.2f}")expected lifetime 16.7 months LTV 160.00, CAC 45.00, LTV/CAC 3.6 CAC payback 4.7 months churn 3%: LTV 320.00 churn 6%: LTV 160.00 churn 10%: LTV 96.00
Small changes in churn have large effects on LTV, because expected lifetime is one over churn: halving churn doubles lifetime value. That is why retention work often pays better than acquisition work. The simple formula has limits: it assumes constant churn, ignores discounting and expansion revenue, and can be wildly optimistic for a new product with only a few months of data. Treat it as a planning tool, and label the inputs as estimates.
Pricing and freemium
Pricing is one of the most powerful product decisions and one of the least tested. Common SaaS models include flat-rate pricing, tiered plans (good, better, best), usage-based pricing (per message, per API call or per seat) and freemium, where a free tier attracts many users and a fraction upgrade to paid. Value-based pricing sets prices according to the value customers receive, rather than cost plus margin or competitor matching. For Driftwood, a free schedule and delay information service is a public good the client must provide anyway; a paid commuter pass with guaranteed alerts and priority boarding could be the revenue product.
Freemium conversion rates are typically low, often cited in the range of a few per cent of free users for self-serve products, so freemium works only when the free tier is cheap to serve, the audience is large and the paid tier offers clear additional value. A free trial, by contrast, gives full access for a limited time and usually converts a higher share. A good free tier is useful on its own; a crippled free tier frustrates users and generates support costs. Pricing changes should be tested and communicated carefully, and must avoid the deceptive practices covered in lesson 12, such as hidden fees or difficult cancellation.
Instrumentation and data quality
Metrics are only as good as the events behind them. Teams keep a tracking plan: a list of events (such as sailing_viewed, alert_subscribed), their properties, when they fire and who owns them. Events are added as part of the definition of done (lesson 6) so features launch measurable. Analytics also involve personal information, so the team collects only what it needs, respects consent requirements, and prefers aggregated or pseudonymous data; lesson 12 covers privacy law. A dashboard nobody trusts is worse than none, so validate new events by comparing them with independent sources, such as Driftwood's ticket counts.
Worked examples
Worked problem
Finding the leak
In the funnel output, which step has the lowest conversion, and what should the team do?
Show solution
- Viewed a sailing to subscribed: 2,340 / 15,600 = 15 per cent, the lowest step.
- Other steps convert at 65 per cent, 70 per cent, 25 per cent and 29 per cent.
- Focus on the subscription offer: test placement and wording, as in lesson 5.
Answer: The subscribe step leaks most; improve it before buying more traffic.
Worked problem
Computing LTV
Price 12 per month, gross margin 80 per cent, monthly churn 6 per cent, CAC 45. Compute LTV and LTV/CAC.
Show solution
- Monthly gross profit per customer = 12 times 0.8 = 9.60.
- Expected lifetime = 1 / 0.06 = 16.7 months.
- LTV = 9.60 times 16.7 = 160.00.
- LTV/CAC = 160 / 45 = 3.6.
Answer: LTV about 160, LTV/CAC about 3.6, matching the code.
Worked problem
Choosing a North Star
The client suggests total app downloads as the North Star. Respond.
Show solution
- Downloads are cumulative and only go up: a vanity metric.
- They measure interest, not value received.
- Propose trips planned with confidence per week, with input and counter-metrics.
Answer: Choose a value-based North Star and explain why downloads mislead.
Common mistakes
MistakeTrack total registered users as the main success metric.
InsteadTrack value-based, actionable metrics such as retention or trips planned with confidence.
MistakeSet a target and trust the number.
InsteadGoodhart's law: pair targets with counter-metrics and judgement.
MistakeUse the overall active-user count to judge retention.
InsteadUse cohort tables; new sign-ups hide departures.
MistakeA higher DAU/MAU is always better.
InsteadThe right frequency depends on the job; segment by user type.
MistakeLTV from a simple formula is a reliable forecast.
InsteadIt assumes constant churn and is sensitive to estimates; treat as a planning tool.
Summary and key terms
- A North Star metric captures core user value, supported by input and counter-metrics.
- Avoid vanity metrics; beware Goodhart's law.
- AARRR funnels show where users drop off.
- Cohort tables reveal retention trends that averages hide.
- DAU/MAU measures stickiness; segment it.
- HEART covers happiness, engagement, adoption, retention and task success.
- LTV, CAC, churn and payback describe unit economics; pricing models trade simplicity against fit.
- North Star metric
- A single measure of the core value a product delivers.
- Input metric
- A driver of the North Star that the team can directly influence.
- Counter-metric
- A metric watched to detect harm from pursuing a target.
- Vanity metric
- A metric that looks impressive but does not inform decisions.
- Goodhart's law
- When a measure becomes a target, it ceases to be a good measure.
- AARRR
- Acquisition, activation, retention, referral and revenue.
- Cohort analysis
- Tracking groups of users who started at the same time.
- DAU/MAU
- Daily divided by monthly active users, a stickiness ratio.
- HEART
- Happiness, engagement, adoption, retention and task success.
- Lifetime value
- Expected gross profit from a customer over the relationship.
Practice problems
Work each problem on paper first, then reveal the answer to check.
What three properties should a North Star have?
Show answer
Measures user value, leads business results, and can be influenced by the team.
Give a counter-metric for alert subscriptions.
Show answer
Alert unsubscribe rate or complaints about frequency.
State Goodhart's law.
Show answer
When a measure becomes a target, it ceases to be a good measure.
What does each letter of AARRR stand for?
Show answer
Acquisition, activation, retention, referral, revenue.
In the cohort table, what evidence suggests the onboarding fix helped?
Show answer
Cohorts from week 3 onward retain better at week 1 than earlier cohorts.
What does a retention curve that flattens above zero indicate?
Show answer
A group of users has formed a habit: a sign of product-market fit.
Why was overall DAU/MAU low in the simulation?
Show answer
Thousands of occasional visitors inflate MAU but seldom appear in DAU.
Name the five HEART categories.
Show answer
Happiness, engagement, adoption, retention, task success.
What happens to LTV if churn halves?
Show answer
It doubles, since lifetime is one over churn.
Why might freemium suit Driftwood's schedule information?
Show answer
Schedule information must be public anyway and is cheap to serve; a paid pass can add value on top.
Lesson quiz · 5 questions
Score 60% or more to complete this lesson.
Create a free account to save your progress, take quizzes and earn a certificate.