
CMPUT-401 · Lesson 4 of 12 · 30 min
Prioritization and roadmapping
A product team always has more good ideas than capacity. Driftwood's backlog after discovery held more than forty candidate items, from an accurate schedule page to reservations, staff dashboards and a loyalty program. Prioritization is the discipline of choosing what to do next and, just as important, what not to do. A roadmap communicates those choices over time to the client, the team and other stakeholders. Both are judgement calls, but structured frameworks make the reasoning visible, expose assumptions and turn arguments about opinions into conversations about evidence.
CMPUT-301 covered estimating effort with relative sizing. Here we take estimates as inputs and focus on value: who benefits, how much, how certain we are, and what it costs to wait. For portfolio-level selection between whole projects, such as whether Driftwood should invest in an app at all or in a new ticket booth, see PMP-140 and BUS-450; this lesson works at the level of features within one product.
Value versus effort
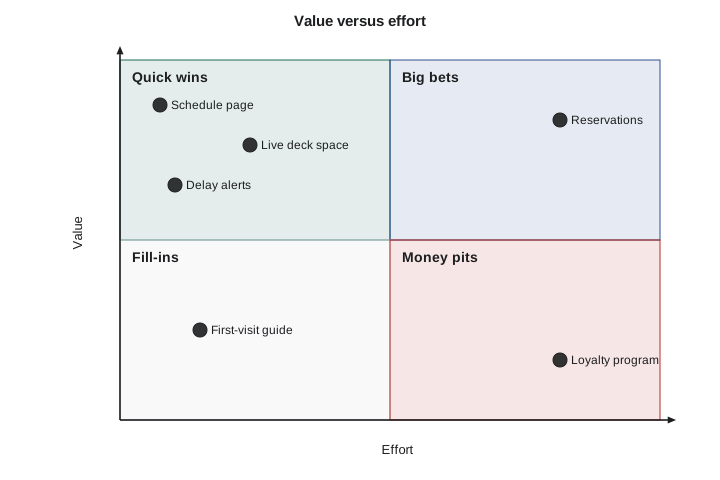
The simplest framework is a two-by-two grid of value against effort. Items with high value and low effort are quick wins; high value and high effort are big bets that need planning; low value and low effort are fill-ins; low value and high effort are money pits to avoid. The grid is fast and visual, which makes it ideal for a first pass in a workshop with the client. Its weakness is that value is a single fuzzy number. Two people can place the same item in different quadrants without realizing they mean different things by value.
RICE
RICE, popularized by Intercom, breaks value into parts. Reach is how many people the item affects in a period, such as travellers per quarter. Impact is how much it affects each person, on a coarse scale such as 3 for massive, 2 for high, 1 for medium, 0.5 for low and 0.25 for minimal. Confidence is how sure the team is about the reach and impact estimates, as a percentage: 100 per cent with strong data, 80 per cent with some, 50 per cent for a hunch. Effort is the total work in person-weeks or person-months. The score is reach times impact times confidence, divided by effort: value per unit of work.
# RICE scoring for Driftwood backlog candidates (all numbers illustrative).
# Reach = people affected per quarter, Impact on a 0.25-3 scale,
# Confidence as a fraction, Effort in person-weeks.
items = [
    # name,                    reach, impact, confidence, effort
    ("Live deck-space indicator", 9000, 2.0, 0.5, 6),
    ("Delay push alerts",         7000, 1.0, 0.8, 2),
    ("Accurate schedule page",   12000, 1.0, 1.0, 1.5),
    ("Reservations",              5000, 3.0, 0.5, 14),
    ("First-visit guide",         3000, 0.5, 0.8, 1),
    ("Staff dashboard",             12, 3.0, 0.8, 3),
]
def rice(r, i, c, e):
    return r * i * c / e
scored = sorted(((rice(*x[1:]), x[0]) for x in items), reverse=True)
print(f"{'item':28s}{'RICE':>9s}")
for score, name in scored:
print(f"{name:28s}{score:9.0f}")item RICE Accurate schedule page 8000 Delay push alerts 2800 Live deck-space indicator 1500 First-visit guide 1200 Reservations 536 Staff dashboard 10
The scores make several things visible. The accurate schedule page wins because almost everyone benefits and it is cheap. Reservations, despite the highest impact, ranks low because the effort is large and the team is unsure about the impact. The staff dashboard scores poorly because only twelve staff use it, even though it matters greatly to them; RICE's reach term systematically undervalues internal tools and features for small but important groups, such as travellers with disabilities. That is not a reason to abandon RICE but a reason to read its output as an input to judgement, not a verdict.
RICE also invites gaming. Whoever fills in the numbers can push a favourite item up by nudging impact or confidence. Good practice is to score as a group, write down the evidence behind each number, and use the confidence term honestly: an item with a 50 per cent confidence score is a candidate for an experiment before a build. The simulation below asks how fragile the ranking is if each estimate could be off by a factor of two in either direction, a realistic error for early product estimates.
# How fragile is a ranking? Perturb RICE inputs and count how often each item is first.
import random
random.seed(401)
items = {
    "Live deck-space indicator": (9000, 2.0, 0.5, 6),
    "Delay push alerts":         (7000, 1.0, 0.8, 2),
    "Accurate schedule page":   (12000, 1.0, 1.0, 1.5),
    "Reservations":              (5000, 3.0, 0.5, 14),
}
wins = {k: 0 for k in items}
trials = 5000
for _ in range(trials):
    best, best_score = None, -1
    for name, (r, i, c, e) in items.items():
        # each estimate could be off by a factor between 0.5 and 2
        f = [2 ** random.uniform(-1, 1) for _ in range(3)]
        score = r * f[0] * i * f[1] * c / (e * f[2])
        if score > best_score:
            best, best_score = name, score
    wins[best] += 1
for name, w in sorted(wins.items(), key=lambda kv: -kv[1]):
print(f"{name:27s} ranked first in {100 * w / trials:5.1f}% of trials")Accurate schedule page ranked first in 82.9% of trials Delay push alerts ranked first in 14.0% of trials Live deck-space indicator ranked first in 3.0% of trials Reservations ranked first in 0.1% of trials
The schedule page stays on top most of the time, but not always; the others trade places often. When a ranking flips under plausible errors, the precise scores mean little, and the team should either gather evidence to shrink the uncertainty or decide on other grounds such as strategy, dependencies or risk.
WSJF and cost of delay
Weighted shortest job first (WSJF), from Don Reinertsen's work on product development flow and used widely in the Scaled Agile Framework (SAFe), asks a different question: what does it cost us to wait? Cost of delay combines business value, time criticality (does value decay if we wait, for example because summer starts in June?) and risk reduction or opportunity enablement (does this item unlock others or retire a big risk?). Each component is scored relative to the others, often on a modified Fibonacci scale, and the sum is divided by job size. Doing the highest WSJF first minimizes total cost of delay across the backlog.
# WSJF = cost of delay / job size. Cost of delay = business value + time criticality
# + risk reduction or opportunity enablement (each on a relative 1-20 scale).
items = {
    #  name:                     (value, time, risk_opp, size)
    "Accurate schedule page":    (13, 20, 8, 2),
    "Live deck-space indicator": (20, 13, 13, 8),
    "Delay push alerts":         (8, 13, 3, 3),
    "Reservations":              (20, 5, 8, 20),
    "Car-counting sensor pilot": (5, 8, 20, 5),
}
rows = []
for name, (v, t, r, size) in items.items():
    cod = v + t + r
    rows.append((cod / size, cod, size, name))
for wsjf, cod, size, name in sorted(rows, reverse=True):
print(f"{name:27s} CoD={cod:2d} size={size:2d} WSJF={wsjf:5.2f}")Accurate schedule page CoD=41 size= 2 WSJF=20.50 Delay push alerts CoD=24 size= 3 WSJF= 8.00 Car-counting sensor pilot CoD=33 size= 5 WSJF= 6.60 Live deck-space indicator CoD=46 size= 8 WSJF= 5.75 Reservations CoD=33 size=20 WSJF= 1.65
WSJF captures two things RICE misses. Time criticality rewards doing summer-critical work before summer. Risk reduction rewards experiments and enabling work, like the car-counting sensor pilot that tells the team whether the live space indicator is feasible at all. In this example, the sensor pilot ranks above the indicator itself, which matches the OST lesson: test the riskiest assumption first. WSJF works best with items of similar granularity and with a team that scores comparatively, not in absolute terms.
MoSCoW
MoSCoW sorts items into Must have, Should have, Could have and Won't have (this time). It originated in the Dynamic Systems Development Method and suits fixed-deadline, fixed-budget work such as a client release or a capstone demo. Must haves define the minimum viable release: without any one of them, the release fails. Should haves are important but the release still works without them. Could haves are nice extras. Won't haves are explicitly out of scope for now, which is often the most valuable category because it records agreements and prevents scope creep. A common guideline is to keep Must haves to about 60 per cent of planned effort so there is room to absorb surprises.
MoSCoW's danger is that everything drifts into Must have, because every stakeholder believes their item is essential. The test question, would we refuse to ship without this, helps. So does insisting that Must haves fit comfortably inside capacity with margin to spare.
Roadmaps
A roadmap is a communication tool that shows the direction of a product over time. Traditional roadmaps are Gantt-style timelines of features with dates. They look precise and satisfy stakeholders who want commitments, but in product work they become fiction quickly, because discovery changes what should be built. Modern product teams prefer outcome-based roadmaps, which show the problems to solve or outcomes to achieve in each period, and now-next-later roadmaps, which replace dates with horizons of decreasing certainty.
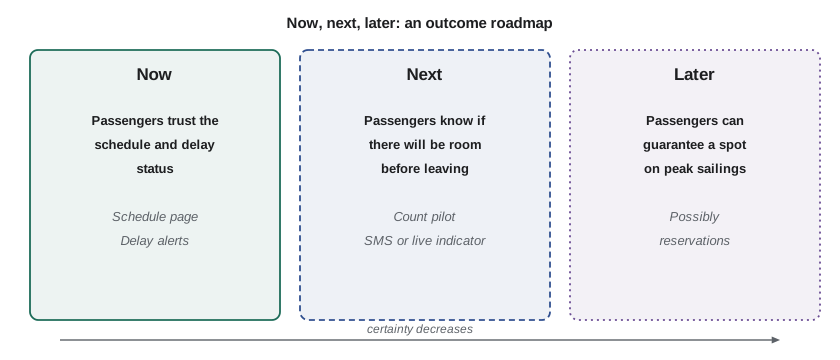
Roadmaps serve different audiences. The client and executives want to know what outcomes to expect and roughly when. The team wants to know what to work on and why. Sales or customer-facing staff want to know what to tell customers. One roadmap rarely serves everyone, so teams often maintain a strategic outcome roadmap plus a more detailed release plan for the next few weeks (lesson 7). Every roadmap should carry a disclaimer that it reflects current plans and will change as the team learns, and the team should review it with stakeholders at a regular cadence, such as monthly.
Client projects add contractual pressure. A fixed-price contract may list features with delivery dates, which pushes towards a feature roadmap. Lesson 11 discusses how to structure contracts so they fix budget and outcomes while leaving room for discovery to change the feature list. Even inside a fixed scope, presenting the roadmap as outcomes helps the client understand why the team might swap one feature for another of equal value.
Saying no
Prioritization means saying no to most requests, including requests from the client who pays. Good PMs say no without damaging relationships: they thank the requester, connect the decision to agreed outcomes and evidence, explain what is being done instead, and offer a path back, such as revisiting next quarter or running an experiment. Not now is often better than no. A visible, regularly reviewed backlog with transparent scoring makes no feel less personal because everyone can see the trade-offs.
Worked examples
Worked problem
Computing a RICE score
Delay push alerts: reach 7,000 per quarter, impact 1, confidence 80 per cent, effort 2 person-weeks. Compute RICE.
Show solution
- Multiply reach, impact and confidence: 7,000 times 1 times 0.8 = 5,600.
- Divide by effort: 5,600 / 2 = 2,800.
Answer: RICE = 2,800, matching the code output.
Worked problem
Computing WSJF
The car-counting sensor pilot has value 5, time criticality 8, risk reduction 20 and size 5. Compute WSJF and explain its rank.
Show solution
- Cost of delay = 5 + 8 + 20 = 33.
- WSJF = 33 / 5 = 6.6.
- The live deck-space indicator has CoD 46 and size 8, so WSJF = 5.75.
- The pilot ranks higher because it is small and retires the biggest feasibility risk.
Answer: WSJF = 6.6; do the pilot before committing to the indicator.
Worked problem
Turning a feature roadmap into outcomes
The client's draft roadmap: June schedule page, July alerts, August live map, autumn reservations. Rewrite as now-next-later outcomes.
Show solution
- Now: travellers trust the published schedule and know about delays promptly (schedule page, alerts).
- Next: travellers know whether there will be room before leaving home (pilot, then indicator or alerts).
- Later: travellers can guarantee a spot on peak sailings (possibly reservations).
Answer: Outcomes replace feature dates, leaving the team free to pick the best solution as evidence arrives.
Common mistakes
MistakeThe highest RICE score must be built first.
InsteadUse RICE as an input; check sensitivity, small important groups, dependencies and strategy.
MistakeConfidence can be set high to keep a favourite item near the top.
InsteadScore as a group with written evidence; low confidence suggests an experiment.
MistakeMost items belong in Must have.
InsteadMust haves are only those without which the release fails; keep them near 60 per cent of effort.
MistakeA roadmap is a delivery commitment with dates.
InsteadA roadmap communicates direction and outcomes and changes as the team learns.
MistakeSaying no to the client damages the relationship.
InsteadExplain the decision against shared outcomes and offer alternatives or a later review.
Summary and key terms
- Prioritization chooses what to do and what not to do; roadmaps communicate those choices.
- Value versus effort is a fast first sort.
- RICE = reach times impact times confidence, divided by effort.
- WSJF = cost of delay divided by job size, rewarding urgent and risk-reducing work.
- MoSCoW sets scope for fixed-deadline releases and records Won't haves.
- Check how sensitive rankings are to estimate errors.
- Prefer outcome-based, now-next-later roadmaps that change as evidence arrives.
- Prioritization
- Choosing the order of work and what to leave out.
- Quick win
- A high-value, low-effort item.
- RICE
- A prioritization score: reach times impact times confidence, divided by effort.
- Cost of delay
- The value lost by waiting to deliver something.
- WSJF
- Weighted shortest job first: cost of delay divided by job size.
- Time criticality
- How quickly the value of an item decays if delayed.
- MoSCoW
- Must, Should, Could and Won't have categories for scope.
- Roadmap
- A communication of a product's intended direction over time.
- Outcome-based roadmap
- A roadmap that lists outcomes or problems rather than features with dates.
- Now-next-later
- A roadmap format using horizons of decreasing certainty instead of dates.
Practice problems
Work each problem on paper first, then reveal the answer to check.
Place reservations on a value-versus-effort grid.
Show answer
Big bet: high value, high effort.
Compute RICE for reach 3,000, impact 0.5, confidence 0.8, effort 1.
Show answer
3,000 times 0.5 times 0.8 / 1 = 1,200.
Why does RICE rank the staff dashboard low?
Show answer
Its reach is only twelve staff, even though impact is high.
What does the sensitivity simulation show?
Show answer
Rankings can flip under plausible estimate errors, so precise scores should not be over-trusted.
What are the three components of cost of delay in SAFe's WSJF?
Show answer
Business value, time criticality and risk reduction or opportunity enablement.
Why does WSJF favour the sensor pilot?
Show answer
It is small and retires a major feasibility risk.
What does the W in MoSCoW stand for?
Show answer
Won't have (this time).
What test identifies a true Must have?
Show answer
Would we refuse to release without it?
Name one advantage of a now-next-later roadmap over a dated feature roadmap.
Show answer
It communicates direction without false precision and adapts to learning.
How should a PM decline a client request?
Show answer
Thank them, link the decision to agreed outcomes and evidence, explain the alternative and offer a review or experiment.
Lesson quiz · 5 questions
Score 60% or more to complete this lesson.
Create a free account to save your progress, take quizzes and earn a certificate.