
CMP-499 · Lesson 12 of 12 · 22 min
Final demonstration, report, presentation and reflection
The last weeks of a capstone decide how the whole project is remembered. A team that built an excellent system but explains it poorly will be judged on the explanation. A team that hands over a working prototype without source files, test data and instructions has delivered a curiosity, not a product the client can use. This lesson follows the TrailCount team through its final requirement scorecard, the final report, the public demonstration and presentation, the handover to Northway and the city, and the reflection that turns two terms of work into lasting learning.
Closing out the requirements
Two weeks before demo day, Lucas updated the verification matrix one last time. Every requirement got a final status, supported by the test, analysis, inspection or demonstration recorded in the plan from lesson 9. The script below summarizes the status and lists the open items that the final report must explain.
# Final requirement scorecard and peer-assessment adjustment factors
status = {'SYS-01': 'met', 'SYS-02': 'met', 'SYS-03': 'met after fix', 'SYS-04': 'met',
          'SYS-05': 'met', 'SYS-06': 'met', 'SYS-07': 'met', 'SYS-08': 'met',
          'SYS-09': 'partly met', 'SYS-10': 'met', 'SYS-11': 'not met', 'SYS-12': 'met'}
from collections import Counter
c = Counter(status.values())
print(', '.join(f"{v}: {n}" for v, n in c.items()))
print('Open items for the report:', [r for r, s in status.items() if s in ('partly met', 'not met')])

# peer ratings (1-5) given by each member to each member, self-ratings excluded
ratings = {'Amira':  {'Jonah': 4.5, 'Keisha': 4.0, 'Lucas': 4.5},
           'Jonah':  {'Amira': 4.5, 'Keisha': 4.0, 'Lucas': 4.0},
           'Keisha': {'Amira': 5.0, 'Jonah': 4.5, 'Lucas': 4.5},
           'Lucas':  {'Amira': 4.5, 'Jonah': 5.0, 'Keisha': 3.5}}
received = {m: [r[m] for g, r in ratings.items() if m in r] for m in ratings}
avg = {m: sum(v) / len(v) for m, v in received.items()}
team = sum(avg.values()) / len(avg)
team_mark = 84
print()
for m in ratings:
    f = min(avg[m] / team, 1.05)          # factor capped at 1.05, as the course outline states
print(f"{m:6s} mean received {avg[m]:.2f} factor {f:.3f} individual mark {team_mark * f:.1f}")met: 9, met after fix: 1, partly met: 1, not met: 1 Open items for the report: ['SYS-09', 'SYS-11'] Amira mean received 4.67 factor 1.050 individual mark 88.2 Jonah mean received 4.67 factor 1.050 individual mark 88.2 Keisha mean received 3.83 factor 0.876 individual mark 73.6 Lucas mean received 4.33 factor 0.990 individual mark 83.2
Nine requirements were met outright, and SYS-03 was met after the cold-start fix. Two were not fully met, and the report explains each. SYS-09, the unit cost target of $450 at a quantity of 100, came in at $468 in the costed bill of materials, 4 % over. Most of the overrun was the 20 W panel, which the team chose deliberately in lesson 4 to protect winter operation; the report shows that a panel bracket integrated into the enclosure lid, which a manufacturer could mould, would bring the cost under target. SYS-11, over-the-air firmware updates, was descoped by an agreed change request in week 6, replaced in the pilot by signed updates through a local service connection. The report documents the change request, the reason and the design work already done toward the full feature, including the dual-bank layout and signature verification.
Reporting unmet requirements honestly is not a failure. Reviewers and clients expect some requirements to fall short in a two-term project. What they look for is a clear statement, the evidence, the reason and a credible path forward. A report that claims everything was met invites the examiner to look for what was hidden.
The final report
The final report is the permanent record of the project. Northway will read it to decide whether to develop TrailCount into a product; the city will read it to decide whether to trust the data; the department will use it as evidence for accreditation; and future students will find it in the library. It must therefore make sense to a reader who was never in the room. Professor Osei's course gives a structure, and most capstone courses use something similar.
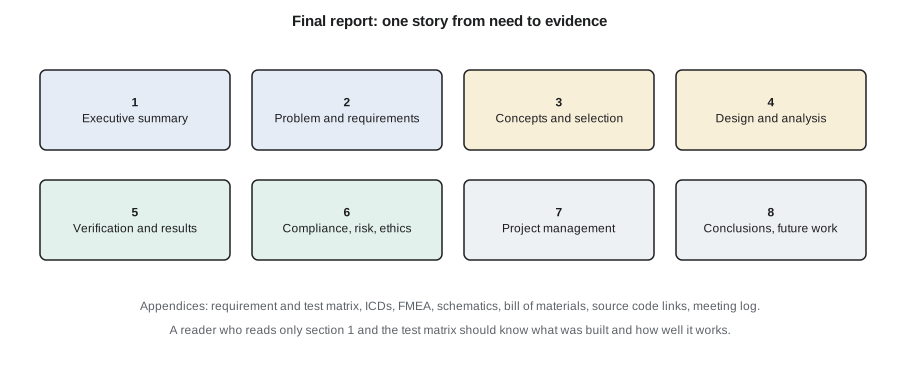
- Executive summary (one page): the problem, the solution, the key results with numbers, what was not achieved, and the recommendation. Many readers will read only this, so it must stand alone.
- Problem and requirements: the client's need, the stakeholders, the requirements baseline with rationale, and any changes with their change requests.
- Concepts and selection: the concepts considered, the screening, the decision matrix and sensitivity analysis, and the rationale. This is where reviewers check that the team evaluated alternatives rather than defending its first idea.
- Design and analysis: the architecture, partitioning, interfaces, and the detailed design of each subsystem, with the analyses that justify it: power budget, tolerance analysis, link budget, reliability estimate.
- Verification and results: the verification plan, the results for every requirement, failures and fixes, the field trial and its statistics.
- Compliance, risk and ethics: applicable standards and regulations, the FMEA and hazard analysis, security controls, and the ethical questions the team faced.
- Project management: the schedule as planned and as executed, the earned value history, the budget, and the team's process.
- Conclusions and future work: what the project achieved, its limitations, and specific recommendations for the next stage.
Appendices hold the material that supports the argument without interrupting it: the full requirement and test matrix, the ICDs, the FMEA, schematics and layouts, the bill of materials, links to the repository with tagged releases, test procedures and raw data locations, and the meeting and decision logs.
Writing well under pressure
The TrailCount team started the report in week 14, as the schedule in lesson 7 required, and wrote it section by section as the work finished, rather than all at once at the end. Each section had an author and a reviewer from the team; Professor Osei reviewed a complete draft three weeks before the deadline; and Ines reviewed it for confidential information and for accuracy about Northway's systems. Several habits made the writing better.
- Lead with the result. Each section starts with its main finding, then supports it. A reader who stops after the first sentence of each section should still learn the most important facts.
- Use numbers, with uncertainty. Not the counter is accurate, but daily totals were within 4.0 % for pedestrians and 3.8 % for cyclists over a 7-day trial, with systematic biases of −2.8 % and +2.3 %.
- Make every figure earn its place, with a caption that states what the reader should notice, and refer to it in the text.
- Write for a busy engineer: short paragraphs, defined terms, consistent names for subsystems and requirements, and no unexplained acronyms.
- Separate fact, inference and opinion. We measured, we infer, we recommend are different claims.
- Cite sources: datasheets, standards, papers and any code or design reused from others.
A team report raises the question of voice and ownership. The team agreed on one style guide and one editor, Amira, who read the whole document for consistency in the final week. Each section's author is listed in an appendix, which the course requires so that individual contributions can be assessed.
The demonstration
Demo day is a public event: faculty, clients, industry visitors, families and other students walk among the teams' booths for an afternoon. A demonstration has a different job from the report. It must show, in a few minutes, that the system works and why it matters. The TrailCount team planned the booth as carefully as a test.
- A live system: one beta node on a short post at the booth, with its radar pointed along a marked lane where visitors could walk or wheel a bicycle past and watch the dashboard count them, separately and by direction, within seconds through a debug view.
- Real data: the dashboard from the field trial on a second screen, showing a week of counts by hour and the comparison with manual counts.
- A poster that a visitor could understand in one minute from three metres away: the need, the system, the headline results and a photograph of the node on the trail.
- A fallback: a recorded video of the live demonstration and a replay mode that fed recorded radar frames into the node, in case the radar misbehaved among a crowd of moving people. The team practised switching to it in under ten seconds.
- A script for each member: a 30-second version for passers-by, a three-minute version for interested visitors and a detailed version for judges, with each member able to give all three.
Crowds are a hard test for a radar counter. In rehearsal the day before, the node counted the team members walking past the booth correctly but was confused by people standing and talking nearby. Amira added a demonstration setting that ignored stationary targets within 2 m, clearly labelled as a demo configuration and not the field firmware. Honesty applies here too: when a judge asked whether the demo firmware was the same as the field firmware, Jonah explained the difference.
The final presentation
The formal presentation, usually 15 to 20 minutes with questions, is where examiners probe the team's understanding. The TrailCount team structured it as a story rather than a chronology: the problem and why it matters, the key decision (radar, LoRaWAN, solar) and the evidence behind it, the hardest technical problems and how they were solved (winter energy, cold start, classification), the verification results including what fell short, and the recommendation. Each member presented the part they led, with clean handovers.
Questions are the most important part. Examiners ask about decisions, not facts: why radar and not infrared, how you know the field trial was large enough, what you would do differently, what happens when the battery ages. The team prepared by listing every question they feared and answering each in two sentences with a number or a reference. The best answers acknowledge limitations directly. When an examiner asked whether 5 % accuracy was good enough, Keisha explained the rationale from lesson 2, linked it to the city's 15 % change-detection need, and noted that the observed weekly bias was within the 3 % goal.
Handover
A capstone is delivered when the client can use it without the team. The TrailCount handover package for Northway and the city contained the tagged firmware and cloud decoder source with build instructions, the schematics, layouts and fabrication files for the beta board, the enclosure and mounting drawings, the bill of materials with suppliers, the test procedures and fixtures, all raw test and field data, the requirement and compliance matrices, the open issue list, a user guide for installers and a short maintenance guide for city staff. Amira ran a fresh build from the repository on a clean computer to prove that the instructions worked; it failed the first time, because a library path was set only on her laptop.
The three pilot nodes stayed on the trail after the course ended, under Northway's maintenance, and continued to send counts to Dana's dashboard. That is the best possible outcome for a capstone: a system that keeps working after its builders have left.
Peer assessment and individual contribution
Most capstone courses grade teams but adjust individual marks using peer assessment and evidence of contribution, such as time logs, repository history and section authorship. The second part of the script shows one common method. Each member rates the others; each member's average received rating is divided by the team average to give an adjustment factor, capped as the course outline specifies; and the individual mark is the team mark times the factor.
In the TrailCount team, Amira and Jonah received factors at the cap of 1.05, Lucas 0.99 and Keisha 0.876. A factor like Keisha's needs scrutiny before it becomes a mark. Professor Osei looked at the evidence: Keisha's time log after week 6, her ownership of the power, enclosure and safety work, and the fact that one rating of 3.5 came from a single teammate after a disagreement over the panel bracket. The course allows the instructor to moderate outliers, and the final factor was raised after a conversation with the team. Peer assessment is a tool for fairness, and like any measurement it needs interpretation. Its existence also encourages the habits the charter promised: logging work, raising concerns early and giving credit.
Worked problem
Computing a peer adjustment factor
A team of four receives average peer ratings of 4.2, 4.6, 4.4 and 3.8. The team mark is 80 and factors are capped at 1.05. Find each member's factor and mark.
Show solution
- The team average of the four averages is
- \[\bar r = \frac{4.2 + 4.6 + 4.4 + 3.8}{4} = 4.25\]
- The factors are each average divided by 4.25: 0.988, 1.082, 1.035 and 0.894.
- The second factor exceeds the cap, so it becomes 1.05.
- \[\text{marks} = 80 \times (0.988,\ 1.05,\ 1.035,\ 0.894) \approx (79.1,\ 84.0,\ 82.8,\ 71.5)\]
Answer: Factors 0.988, 1.05 (capped), 1.035 and 0.894, giving marks of about 79.1, 84.0, 82.8 and 71.5, subject to the instructor's review of the evidence.
Reflection
The last assignment in the course is a short individual reflection, and it is easy to treat it as a formality. It is not. Engineers improve by examining their own experience, and the graduate attributes of both Canadian and US accreditation include learning from experience and life-long learning. A useful reflection is specific. It describes a situation, what the writer did, what happened, and what they will do differently, rather than general statements about teamwork being important.
The TrailCount team's reflections had common threads. Jonah wrote that the capacity plan in week 2 changed how he thinks about every project: scope must fit the hours, and the conversation about cutting it is easier early. Amira wrote about the field data: she had expected the classifier to be a coding problem and found it was a data problem, solved by recording real scenes and testing against them. Keisha wrote about the cold start failure: the datasheet had the answer all along, and she now reads the start-up conditions, not just the operating range. Lucas wrote about earned value: the week 6 numbers felt alarming, but they bought the team six weeks to fix the problem. All four wrote about the client: Ines's questions, sometimes uncomfortable, made the system better.
That is the real purpose of a capstone. The TrailCount node is a useful device, and the city now has better trail counts than it has ever had. But the lasting result is four engineers who have taken a vague need to a working, verified, documented system with a team, a client, a budget and a deadline, and who know what they would do differently next time. Every course in the program led here, and every project after graduation will build on it.
Common mistakes
MistakeClaiming every requirement was met.
InsteadReport each requirement's status honestly, with evidence, reasons and a path forward for anything unmet.
MistakeWriting the report in the last week.
InsteadWrite sections as the work finishes, with internal review, an advisor review of a full draft and a client review for confidentiality.
MistakeRelying on a live demonstration with no fallback.
InsteadRehearse in realistic conditions and prepare recorded or replay modes you can switch to quickly.
MistakePresenting the project as a chronology.
InsteadTell a story built around the problem, the key decisions and evidence, the hardest problems and the results.
MistakeHanding over a working prototype without source, data and instructions.
InsteadDeliver a complete package, and prove the build instructions on a clean machine.
Summary and key terms
- Close out every requirement with evidence; explain unmet requirements with reasons and a credible path forward.
- The final report tells one story from need to evidence, with an executive summary that stands alone and appendices that support it.
- Good technical writing leads with results, uses numbers with uncertainty, separates fact from inference and cites sources.
- Demonstrations need a live system, real data, a clear poster, a fallback and rehearsed scripts of several lengths.
- Handover means the client can build, test, install and maintain the system without the team.
- Peer assessment adjusts individual marks with evidence and moderation; specific reflection turns experience into learning.
- Executive summary
- A one-page summary of a report's problem, solution, results and recommendations that stands alone.
- Verification matrix
- A table of every requirement with its verification activity, result and status.
- Handover package
- The files, data and documentation a client needs to use and maintain a delivered system.
- Demonstration
- Showing the operating system to an audience to convey that it works and why it matters.
- Fallback
- A prepared alternative, such as a recording or replay mode, used if a live demonstration fails.
- Peer assessment
- Team members rating each other's contributions, used to adjust individual marks.
- Adjustment factor
- A member's average peer rating divided by the team average, often capped.
- Reflection
- A structured review of one's own experience that identifies specific lessons and changes in practice.
Practice problems
Work each problem on paper first, then reveal the answer to check.
The costed bill of materials is $468 against a $450 target. What percentage over target is it?
Show answer
(468 − 450) / 450 = 4 % over.
A team mark is 76 and a member's factor is 1.02. What is the individual mark?
Show answer
76 × 1.02 ≈ 77.5.
Rewrite as a result-first sentence: We did a lot of testing and the node seemed to work well in the field.
Show answer
For example: Over a 7-day field trial, daily totals were within 4.0 % of manual counts for pedestrians and 3.8 % for cyclists.
Why did Amira rebuild the firmware from the repository on a clean computer before handover?
Show answer
To prove that the build instructions were complete; the first attempt revealed a library path set only on her laptop.
Lesson quiz · 5 questions
Score 60% or more to complete this lesson.
Create a free account to save your progress, take quizzes and earn a certificate.