
CMP-499 · Lesson 10 of 12 · 20 min
Reliability, safety and security by design
A capstone prototype needs to work on demo day. A product needs to work for years, in rain and frost, without hurting anyone and without becoming a foothold for an attacker. The city plans to deploy TrailCount nodes at 40 sites for five years or more, so Ines asked the team to show, at the critical design review, how the design addresses reliability, safety and security. None of these can be added at the end. Each is a property of the architecture and the detailed design, and each has its own methods. This lesson introduces them at the level a graduating engineer needs.
Reliability: what the numbers mean
Reliability is the probability that a system performs its function under stated conditions for a stated time. For many electronic parts during their useful life, failures occur at a roughly constant rate, λ, and the probability of surviving to time t is then R(t) = e^(−λt). The mean time between failures, MTBF, is 1/λ for a repairable system with a constant rate. Failure rates of electronic parts are often given in FIT, failures per billion (10^9) device-hours.
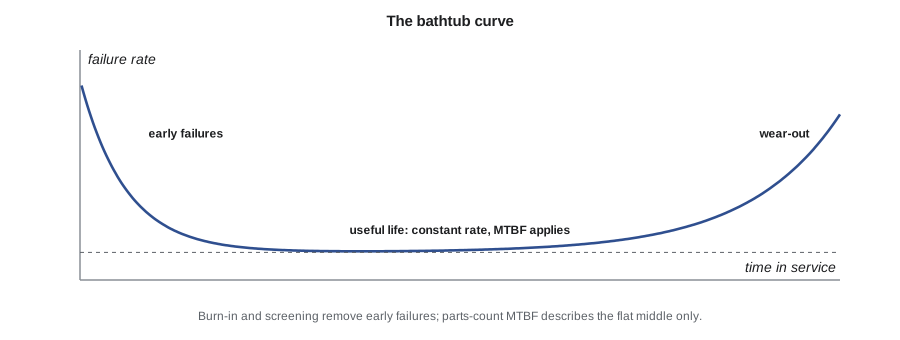
The constant rate is only part of the story. Real populations show the bathtub curve: early failures from manufacturing defects, a long flat period of random failures, and a rise as parts wear out. Burn-in and production testing remove many early failures. Wear-out mechanisms, such as battery capacity fade, gasket hardening, connector corrosion, electrolytic capacitor drying and flash memory wear, are not described by MTBF at all and need their own analysis. The most common misreading of reliability numbers is to treat a high MTBF as a lifetime.
A parts-count prediction
Early in a design, engineers estimate reliability with a parts-count prediction: add up the failure rates of all the parts, adjusted for their stresses. Handbooks such as the long-established MIL-HDBK-217 and the telecommunications industry's SR-332 provide base rates and adjustment factors; component makers publish their own reliability data. The most important stress is temperature, and its effect is often modelled with the Arrhenius relation, which says that many failure mechanisms speed up exponentially with absolute temperature.
Here Ea is an activation energy for the failure mechanism in electronvolts, k is Boltzmann's constant (8.617 × 10^(−5) eV/K), and the temperatures are in kelvins. An activation energy of 0.7 eV is a common assumption for semiconductor mechanisms, and it means a part fails roughly twice as fast for every 10 °C rise near room temperature.
import math
# Parts-count reliability estimate with temperature acceleration (Arrhenius)
# base failure rates in FIT (failures per 10^9 device-hours) at 40 C, illustrative values
parts = {  # name: (quantity, FIT each, activation energy eV)
    'Microcontroller':         (1,  20, 0.7),
    'Radar module':            (1,  60, 0.7),
    'LoRa module':             (1,  30, 0.7),
    'Charger and regulators':  (3,  15, 0.7),
    'Ceramic capacitors':      (48, 0.5, 0.3),
    'Resistors':               (60, 0.2, 0.3),
    'Connectors and glands':   (5,  10, 0.3),
    'LiFePO4 cell':            (1, 150, 0.5),
}
k = 8.617e-5                      # Boltzmann constant, eV/K
def af(ea, t_use, t_ref=40):      # acceleration factor from t_ref to t_use (C)
    return math.exp(ea / k * (1 / (t_ref + 273.15) - 1 / (t_use + 273.15)))
for t in (40, 55):
    fit = sum(q * f * af(ea, t) for q, f, ea in parts.values())
    mtbf = 1e9 / fit
    years = 5 * 8766
    print(f"Enclosure average {t} C: {fit:5.0f} FIT, MTBF {mtbf:,.0f} h ({mtbf / 8766:.0f} years)")
    print(f"  P(one node survives 5 years) = {math.exp(-years / mtbf):.3f}; "
          f"expected failures in 40 nodes over 5 years = {40 * years / mtbf:.1f}")
share = {n: q * f for n, (q, f, ea) in parts.items()}
tot = sum(share.values())
print('\nLargest contributors at 40 C:')
for n, v in sorted(share.items(), key=lambda x: -x[1])[:3]:
print(f" {n:24s} {v / tot:.0%}")Enclosure average 40 C: 391 FIT, MTBF 2,557,545 h (292 years) P(one node survives 5 years) = 0.983; expected failures in 40 nodes over 5 years = 0.7 Enclosure average 55 C: 1000 FIT, MTBF 999,791 h (114 years) P(one node survives 5 years) = 0.957; expected failures in 40 nodes over 5 years = 1.8 Largest contributors at 40 C: LiFePO4 cell 38% Radar module 15% Connectors and glands 13%
With illustrative failure rates, the node's predicted rate is about 391 FIT at an average enclosure temperature of 40 °C, an MTBF of about 2.6 million hours. That does not mean a node lasts 292 years. It means that in a population of nodes during their useful life, random failures are rare: the probability that one node has a random failure in five years is about 1.7 %, and across 40 nodes the city should expect less than one such failure over five years. At an average of 55 °C the rate rises to about 1,000 FIT and the expected count to about 1.8. The enclosure sits in the sun, so Keisha added a white sun shield and checked that the average internal temperature stays well below 55 °C in summer.
The ranking of contributors is as useful as the total. The LiFePO4 cell contributes 38 % of the random failure rate, and it is also the part most likely to wear out, so the team specified a cell with a long rated cycle life, kept its charge voltage slightly below the maximum, and recommended replacing it at a planned interval. The connectors and cable glands contribute 13 %, which supported the FMEA's attention to the enclosure seal.
Worked problem
Survival probability and expected failures
A fleet of 40 nodes has a constant failure rate of 391 FIT each. What is the probability that a given node survives 5 years without a random failure, and how many failures are expected across the fleet?
Show solution
- Convert the rate to failures per hour and the time to hours:
- \[\lambda = 391 \times 10^{-9}\ \text{h}^{-1}, \quad t = 5 \times 8{,}766 = 43{,}830\ \text{h}\]
- \[R(t) = e^{-\lambda t} = e^{-0.01714} \approx 0.983\]
- Expected failures in the fleet, for small λt:
- \[N \approx 40 \lambda t = 40 \times 0.01714 \approx 0.69\]
Answer: About 98.3 % survival per node and about 0.7 expected random failures across 40 nodes in 5 years, before wear-out is considered.
Designing for reliability
Predictions identify weak points; design choices fix them. The team applied several well-known practices. Derating: operate parts well below their maximum ratings, typically capacitors at no more than half their voltage rating, resistors at no more than half their power rating, and semiconductors well below their maximum junction temperatures. Protection: transient voltage suppressors on the panel input and the antenna port, reverse-polarity protection on the battery, and current limiting on every output. Environmental margins: conformal coating on the boards to resist condensation, parts rated for the full temperature range, and a vent membrane to prevent pressure pumping. Recovery: a hardware watchdog and an external supervisor that reset the processor if firmware hangs, with the reset cause logged and reported. And observability: every uplink includes health data, so the team and the city can see problems developing, such as a battery that charges less each week, before the node stops.
Safety
TrailCount runs from a 3.2 V cell and a small solar panel, so electric shock is not a hazard. But low voltage is not the same as safe. The lithium cell stores about 38 Wh, enough to cause a fire if it is short-circuited, overcharged, crushed or charged when frozen. The node is mounted on a post above a public path, so a falling enclosure could injure someone. And radio frequency exposure from the radar and LoRa transmitters must stay within regulatory limits, which for such low-power devices is normally easy to show.
The team used a simple hazard analysis, related to the FMEA but organized around harms rather than component failures. For each hazard it listed the causes, the severity of the harm, and the controls, following the usual order of preference: eliminate the hazard by design, add engineered safeguards, and only then rely on warnings and procedures. For the battery: a cell chemistry chosen for thermal stability (LiFePO4 rather than a higher-energy chemistry), a cell with a built-in protection circuit, a fuse at the cell terminals, charger cutoffs for voltage and temperature, and a vented compartment. For the mounting: stainless steel band clamps rated for the load with a safety factor, a secondary tether, and an installation procedure tested in SYS-10. The analysis went into the CDR package, and Keisha, as safety officer, owned its updates.
Safety-critical systems, such as railway signalling, medical devices and vehicle controls, follow formal functional safety standards, for example IEC 61508 and its sector derivatives, which define safety integrity levels and rigorous processes. TrailCount does not control anything that could hurt someone, and the team's report said so explicitly, explaining why those standards do not apply. Knowing when a standard applies, and recording why it does not, is part of professional judgment.
Security by design
A connected device on a public trail is exposed to attackers in two ways. Remotely, someone could try to send forged data, replay old messages, or exploit the update mechanism. Physically, someone could open the enclosure, connect to the debug port and read the firmware or the keys. The consequences for TrailCount are modest compared with, say, a traffic signal, but they are real: falsified counts could mislead city decisions, stolen keys could let an attacker impersonate nodes, and a compromised update could disable the whole fleet. Northway also cares about its reputation; a sensor that becomes part of a botnet is a news story.
Security by design means considering these threats from the architecture onward rather than adding security after the system works. The team followed a defensive process in three steps: model the threats, choose controls, and verify them.
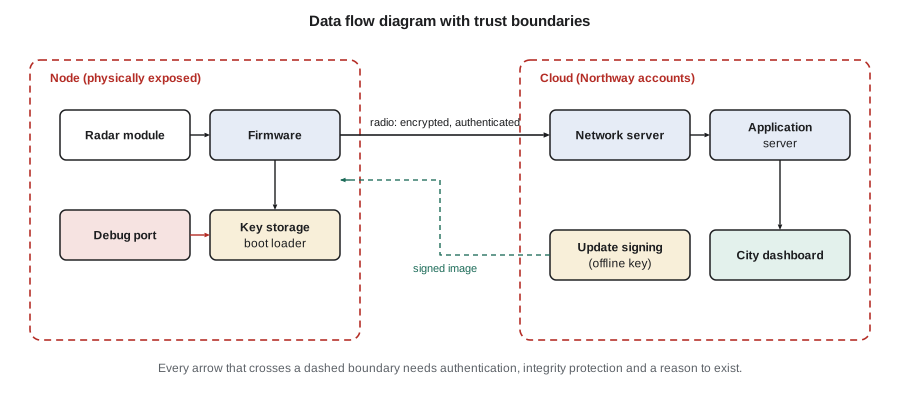
Threat modelling starts with a data flow diagram that marks trust boundaries: places where data crosses from one level of trust to another. For each flow across a boundary, the team asked what could go wrong, using the STRIDE categories that many security teams use as a checklist: spoofing (pretending to be a node or the server), tampering (changing data or firmware), repudiation (denying an action), information disclosure (reading data or keys), denial of service (stopping the node or flooding the network) and elevation of privilege (gaining more control than allowed). The point is not to fill in every box but to make sure no obvious threat is missed.
The controls the team chose are standard good practice for connected devices, and most come from published baselines such as the NIST guidance on IoT device cybersecurity capabilities and the European consumer IoT standard ETSI EN 303 645, which many manufacturers use as a reference even outside Europe.
- Unique credentials per device: each node gets its own LoRaWAN root keys at production, never a shared or default key. LoRaWAN encrypts application payloads and authenticates every frame with a message integrity code, and frame counters reject replayed messages.
- Secure boot: the boot loader checks a digital signature on the application firmware before running it. Images are signed with a private key kept offline at Northway, never on a build server or a laptop. A node accepts only images signed with that key and refuses older versions, which prevents rolling back to a version with a known flaw.
- Safe updates: the dual-bank scheme from lesson 6, so a failed or interrupted update falls back to the old image. Because SYS-11 was descoped, updates for the pilot happen through a local service connection, but the signing and verification are the same as they will be for over-the-air updates.
- Locked debug: the debug port is disabled in production firmware, and the microcontroller's read protection is enabled, so connecting a probe does not reveal the firmware or keys.
- Minimal attack surface: the node accepts only a small set of authenticated downlink commands, each validated for range, and has no open services.
- A vulnerability disclosure contact: Northway publishes an address where researchers can report problems, and commits to a response process. This is part of the product, not an afterthought.
Verification of security controls is part of the verification plan. The team tested that the node rejects an unsigned image, an image signed with a different key, an older signed image and a corrupted image; that replayed uplinks are rejected by the network server; that the debug port does not respond on production builds; and that out-of-range downlink values are ignored. All these tests are defensive: they check that the protections the team designed actually work.
Common mistakes
MistakeReading an MTBF of millions of hours as the product's lifetime.
InsteadUse MTBF only for the constant-rate period; analyze wear-out mechanisms such as battery fade and seal ageing separately.
MistakeIgnoring temperature in reliability estimates.
InsteadAdjust failure rates for operating temperature, for example with the Arrhenius relation, and reduce internal temperatures where possible.
MistakeAssuming a low-voltage product has no safety hazards.
InsteadAnalyze stored energy, mechanical, thermal and radio frequency hazards, and control them by elimination first.
MistakeShipping devices with shared default keys or an open debug port.
InsteadProvision unique keys, enable secure boot with offline signing keys, and lock debug access in production.
MistakeAdding security after the system works.
InsteadThreat-model the architecture, choose controls from published baselines, and verify each control with tests.
Summary and key terms
- Reliability R(t) = e^(−λt) for a constant failure rate; MTBF = 1/λ; FIT counts failures per 10^9 device-hours.
- The bathtub curve has early failures, a constant-rate useful life and wear-out; MTBF describes only the middle.
- Parts-count predictions with Arrhenius temperature acceleration identify the largest contributors and the effect of heat.
- Design for reliability with derating, protection, environmental margins, recovery mechanisms and health reporting.
- Hazard analysis covers stored energy, mechanical and other hazards, controlled by elimination, safeguards and then procedures.
- Security by design uses threat modelling with trust boundaries, unique keys, secure boot, safe updates, locked debug and verification tests.
- Reliability
- The probability that a system performs its function under stated conditions for a stated time.
- Failure rate
- The frequency of failures per unit time, often expressed in FIT.
- MTBF
- Mean time between failures; 1/λ for a constant failure rate.
- Arrhenius relation
- A model in which failure mechanisms accelerate exponentially with absolute temperature.
- Derating
- Operating a component well below its maximum ratings to improve reliability.
- Hazard analysis
- Identifying sources of harm, their causes and severity, and the controls that reduce risk.
- Threat model
- A structured description of what an attacker might do to a system and how the design responds.
- Secure boot
- A start-up process that runs only firmware whose digital signature verifies against a trusted key.
Practice problems
Work each problem on paper first, then reveal the answer to check.
A part has a constant failure rate of 200 FIT. What is the probability it survives 10 years (87,660 h)?
Show answer
λt = 200 × 10^(−9) × 87,660 ≈ 0.0175; R ≈ e^(−0.0175) ≈ 0.983.
Using Ea = 0.7 eV, find the acceleration factor from 40 °C to 50 °C.
Show answer
AF = exp[(0.7 / 8.617 × 10^(−5)) × (1/313.15 − 1/323.15)] ≈ exp(0.80) ≈ 2.2.
Which STRIDE category describes replaying an old uplink to inflate counts?
Show answer
Tampering, and in part spoofing; LoRaWAN frame counters reject replayed frames.
Why must the firmware-signing key be kept offline?
Show answer
If it were stolen from a networked build machine, an attacker could sign malicious firmware that every node would accept.
Lesson quiz · 5 questions
Score 60% or more to complete this lesson.
Create a free account to save your progress, take quizzes and earn a certificate.