
CINE-202 · Lesson 3 of 12 · 25 min
Waveforms, histograms and vectorscopes
Monitors lie. Their brightness, contrast and colour depend on calibration, viewing angle, ambient light and the LUT being applied, and even a well-calibrated on-set monitor viewed in bright daylight can make an image look darker or brighter than it is. Scopes measure the signal itself, giving objective information about exposure and colour that does not depend on the display. They are the cinematographer's and DIT's most reliable instruments for judging exposure on set and the colourist's for grading. This lesson covers the waveform monitor and how to read it, IRE and code values, the RGB parade, histograms, the vectorscope, what scopes measure in log and display modes, practical exposure targets, and scopes in grading and quality control.
The waveform monitor
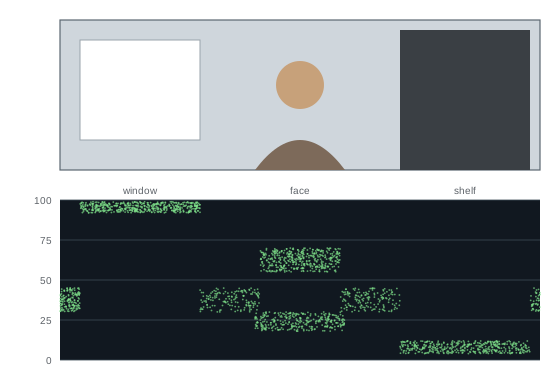
A waveform monitor plots the brightness of the image: the horizontal axis corresponds to the horizontal position in the frame, from left to right, and the vertical axis shows signal level, from black at the bottom to white or peak at the top. Every pixel in a column of the image is plotted at its brightness value in the corresponding column of the waveform. A bright window on the left of the frame produces a cluster of traces high on the left of the waveform; a dark corner on the right produces traces low on the right. Because the horizontal position is preserved, the waveform shows not only how bright things are but where they are, which makes it easy to identify which part of the scene is causing a problem. Most waveforms display luminance (luma) by default, a weighted combination of the red, green and blue channels.
IRE, percentages and code values
Waveform scales are commonly marked from 0 to 100, in units called IRE (after the Institute of Radio Engineers, which defined them for analogue television) or simply as percentages. In digital video, these map to code values. In 10-bit video, values run from 0 to 1023, but standard "legal" or "video" range places black at code 64 and nominal white at 940, leaving headroom and footroom; "full" or "data" range uses 0 to 1023. Many scopes can display either IRE-style percentages or code values. Confusion between legal and full range is a common source of crushed blacks and clipped whites in pipelines, which Lesson 9 returns to. Some waveforms display levels above 100 % (superwhites up to about 109 %) and below 0 %, useful for checking whether a signal exceeds broadcast limits.
| Scale | Black | Nominal white | Notes |
|---|---|---|---|
| IRE / percent | 0 | 100 | Common display on scopes |
| 10-bit legal range | 64 | 940 | Broadcast and most video files |
| 10-bit full range | 0 | 1023 | Many log and data formats |
| 8-bit legal range | 16 | 235 | Older and consumer video |
Reading exposure on a waveform
On set, the waveform shows where key tones sit and whether anything important is clipping or crushing. Clipped highlights appear as a flat, hard line at the top of the trace, because many pixels have reached the maximum value; crushed shadows appear as a flat line at the bottom. Because waveforms are usually viewed with a monitoring LUT applied, it is essential to know whether the scope is reading the log signal or the LUT output. Each approach has uses:
- Waveform on the log signal: shows exactly what the camera is recording, including all the highlight and shadow information. Middle grey and skin tones fall at the camera's published log values, and clipping is the sensor's true clipping point. This is the most accurate guide to recorded exposure.
- Waveform on the LUT output: shows how the image will look on a Rec.709 or HDR display with the show LUT, which is useful for judging the intended look, but clipping in the LUT output may not mean the recording is clipped, since the LUT compresses highlights.
Many cinematographers set exposure using a log waveform or false colour (Lesson 4) and judge the look on a monitor with the LUT applied.
Typical exposure targets
Exposure targets depend on the camera's log curve or the display transform. Approximate values in Rec.709 display terms, after a normal LUT, are useful starting points:
- Diffuse white, such as a white shirt or paper, around 85 to 95 %.
- Light skin around 60 to 70 %, medium skin around 45 to 60 %, darker skin around 30 to 45 %, depending on the person, the lighting and the look.
- Middle grey around 40 to 45 %.
- Deep shadows with detail around 5 to 15 %.
In log, the values are lower and more compressed: for example, middle grey in ARRI LogC3 sits at about 39 % (around code value 400 in 10-bit), in Sony S-Log3 at about 41 %, in Panasonic V-Log at about 42 %, and in ARRI LogC4 at about 28 %. Lesson 6 covers log curves. These figures are guides, not rules: exposure should serve the scene and the skin tones of the people in it, and dark-skinned performers in particular should be lit and exposed with care so that their skin retains detail and colour, rather than being forced to a value chosen for lighter skin.
The RGB parade
An RGB parade displays three waveforms side by side, one each for the red, green and blue channels. It reveals colour balance and channel clipping that a luma waveform hides. A neutral grey or white object produces traces at the same height in all three channels; if one channel sits higher, the object has a colour cast. Under warm tungsten light without correct white balance, the red channel sits higher and the blue lower. A saturated red dress or a blue light may clip in one channel while the luma waveform looks safe, and clipped single channels can produce flat, posterized colour. The parade is the colourist's main tool for balancing shots and matching cameras, and it is useful on set for checking white balance against a grey card.
Worked problem
Diagnosing a colour cast with a parade
A grey card filmed under mixed light shows red at 45 %, green at 42 % and blue at 36 % on the RGB parade in Rec.709. What does this indicate, and how could it be corrected on set or in grading?
Show solution
- A neutral card should show equal levels in all three channels.
- Red is higher and blue lower, so the image is warm, with a slight orange cast.
- On set, raise the camera's white balance in kelvin, or gel the dominant warm source, and re-check until the traces align.
- In grading, the colourist would lower red and raise blue on the card until the three traces match.
Answer: The image is warm (orange cast); adjust white balance or lighting on set, or balance the channels in grading so the grey card reads equal.
Histograms
A histogram shows the distribution of brightness values: the horizontal axis runs from black on the left to white on the right, and the height at each point shows how many pixels have that value. It gives a quick overview of overall exposure and whether the image is clipping, shown by a spike against the right or left edge. Unlike a waveform, a histogram discards information about where in the frame each value occurs, so it cannot tell you whether a spike is the sky, a white shirt or a lamp. Histograms are common on stills cameras and smaller video cameras and useful for quick checks, but waveforms are preferred in professional cinematography because of their spatial information.
The vectorscope
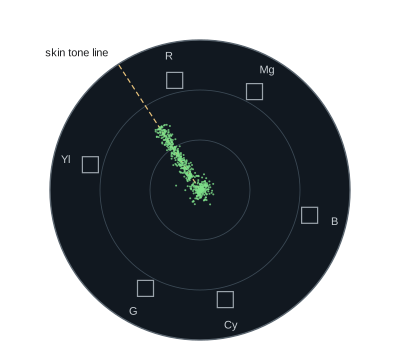
A vectorscope displays colour, not brightness. It plots each pixel by its hue, shown as angle around a circle, and its saturation, shown as distance from the centre. Neutral greys, whites and blacks fall at the centre; saturated colours lie toward the edge. Target boxes mark the positions of standard colour bars: red, magenta, blue, cyan, green and yellow. A line from the centre between red and yellow, known as the skin tone line or I-line, marks the hue at which human skin of all ethnicities tends to fall, since skin colour varies mainly in brightness and saturation rather than hue. A vectorscope shows at a glance whether the image has a colour cast (the cluster is offset from the centre), whether skin tones are on the line, and whether colours are oversaturated, beyond the limits for broadcast.
Scopes on set and in grading
On set, cinematographers and DITs often keep a waveform and sometimes a parade or vectorscope visible on a monitor or in the camera, checking exposure for each setup and watching for clipping during takes. DITs use calibrated scopes in their carts to set looks, check white balance and confirm that cameras match in multi-camera shoots. In grading, colourists use waveforms and parades constantly to set black and white levels, balance colour, match shots and ensure that the final image stays within delivery specifications. For broadcast and many streaming deliverables, quality control checks confirm that levels and colours fall within legal ranges and that there are no illegal superwhites, out-of-gamut colours or crushed black levels.
Scope tips
Effective use of scopes comes with practice. Learn the scale settings of each scope you use, including whether it reads log or LUT output, legal or full range, luma or RGB. Use a known reference, such as a grey card or chart, to confirm that the camera and scope agree with the meter. Look for the important parts of the frame rather than the whole trace: a face, a window, a dark corner. Remember that scopes measure the signal, not the creative intent: a deliberately dark scene may look low on the waveform, and that is fine if it was planned. Combine scopes with a well-calibrated monitor and the viewing conditions of the final audience in mind.
Waveform display modes
Waveform monitors offer several display modes beyond the standard luma trace. YCbCr modes show the luma and the two colour difference signals separately, useful for engineering checks. Overlay modes superimpose the red, green and blue traces in their own colours on one graticule, making it easy to see where channels diverge. Line select modes display a single horizontal line of the image, useful for measuring specific objects precisely. Zoomed and magnified modes enlarge parts of the scale, such as the region near black, for precise level setting. Many monitors and software scopes also offer a false-colour-coded waveform, in which the trace is coloured according to the image's own colours, helping to relate traces to objects. Learning these modes on the scopes you use makes diagnosis faster.
Scopes for matching cameras
In multi-camera shoots, scopes are the most reliable way to match cameras. With all cameras framing the same chart under the same light, the DIT compares their waveforms and parades, adjusting exposure, white balance and, if necessary, CDL values until the grey patches align in level and the colour patches sit in the same positions on the vectorscope. Even cameras of the same model can differ slightly, and different models or manufacturers can differ substantially, particularly in saturated colours and skin tones. Matching on set reduces the work required in grading and gives the director a consistent view across cameras in video village.
Scopes and HDR
HDR monitoring requires scopes calibrated in nits rather than percentages, with scales that follow the PQ or HLG curve. On a PQ waveform, 100 nits sits at about 51 % of the signal range and 1,000 nits at about 75 %, so diffuse white and skin appear at familiar positions while highlights extend into the upper range. Many scopes allow switching between nits and percentages, and between SDR and HDR scales, and DITs often monitor both an SDR and an HDR scope side by side when productions deliver both versions.
Common mistakes
MistakeJudging exposure by monitor brightness alone.
InsteadUse waveforms and false colour to measure the signal.
MistakeReading the LUT output as if it were the recording.
InsteadKnow whether the scope shows log or LUT values.
MistakeIgnoring single-channel clipping.
InsteadCheck the RGB parade with saturated colours.
MistakeForcing all skin tones to one IRE value.
InsteadExpose each person's skin for detail and colour.
MistakeConfusing legal and full range.
InsteadConfirm the range of scopes and files.
Summary and key terms
- Waveforms plot brightness against horizontal position in the frame.
- Scales run 0–100 IRE or code values in legal or full range.
- Know whether scopes read log or LUT output.
- Typical Rec.709 targets: white 85–95 %, middle grey 40–45 %.
- RGB parades reveal colour casts and channel clipping.
- Histograms show distribution but not position.
- Vectorscopes show hue and saturation, with the skin tone line as reference.
- Waveform monitor
- Scope plotting brightness against horizontal position.
- IRE
- Unit of video level from 0 to 100.
- Legal range
- Video levels from 64 to 940 in 10-bit.
- Full range
- Video levels from 0 to 1023 in 10-bit.
- Luma
- Weighted brightness signal from RGB.
- RGB parade
- Separate waveforms for red, green and blue.
- Histogram
- Distribution of pixel brightness values.
- Vectorscope
- Scope plotting hue and saturation.
- Skin tone line
- Vectorscope line where skin hues fall.
- Superwhite
- Video level above nominal white.
Practice problems
Work each problem on paper first, then reveal the answer to check.
What does the horizontal axis of a waveform represent?
Show answer
Horizontal position in the frame.
How does clipping appear on a waveform?
Show answer
A flat line at the top of the trace.
Black and white in 10-bit legal range?
Show answer
64 and 940.
Why read a waveform on the log signal?
Show answer
It shows exactly what is recorded.
Typical Rec.709 level for diffuse white?
Show answer
About 85–95 %.
Middle grey in S-Log3?
Show answer
About 41 %.
What does an RGB parade show on a neutral card?
Show answer
Equal levels if balanced.
What information does a histogram lack?
Show answer
Where in the frame values occur.
Where do neutral tones fall on a vectorscope?
Show answer
At the centre.
What is the skin tone line?
Show answer
A line between red and yellow where skin hues fall.
Lesson quiz · 5 questions
Score 60% or more to complete this lesson.
Create a free account to save your progress, take quizzes and earn a certificate.