
CHEM-211 · Lesson 8 of 12 · 28 min
Acid-base titrations: curves, indicators and endpoints
Acid–base titration is one of the oldest and still most widely used quantitative methods. Water utilities titrate alkalinity every day; food laboratories titrate the acidity of vinegar, wine and milk; the Kjeldahl titration of ammonia is still the reference method for protein in food and feed; and pharmacopoeias specify titrations for the assay of many drugs. This lesson develops the exact theory of titration curves, explains how indicators work and how to choose them, shows how to locate endpoints from pH data, and works through the key applications.
Vocabulary
In a titration, a solution of accurately known concentration, the titrant, is added from a burette to the analyte until the reaction is complete. The equivalence point is the point at which the amount of titrant added is exactly stoichiometric with the analyte. It is a theoretical point. The endpoint is what we actually observe: a sudden change in indicator colour, pH or another property. The difference between the endpoint and the equivalence point is the titration error, which a good choice of indicator or endpoint method keeps small. A blank titration, in which the same procedure is carried out without analyte, measures the titrant needed to change the indicator itself and any acidic or basic impurities in the reagents; it is subtracted from the sample titration.
Requirements for a titration reaction: it must have a known stoichiometry, go essentially to completion (a large equilibrium constant), be fast, and have a way of detecting the equivalence point. The reaction of a strong acid with a strong base (K = 1/Kw = 10¹⁴) satisfies all of these superbly; the titration of a weak acid with a strong base is less complete but still excellent if Ka is not too small.
Standardizing the titrants
Sodium hydroxide titrant is standardized against potassium hydrogen phthalate (KHP), dried at 110 °C, using phenolphthalein. NaOH solutions absorb CO₂ from the air, forming carbonate: 2OH⁻ + CO₂ → CO₃²⁻ + H₂O. Carbonate is a weaker base, and depending on the endpoint pH it reacts with one or two protons, which causes a carbonate error. To minimize it, NaOH is prepared from a 50 % (w/w) stock, in which sodium carbonate is insoluble and settles out, diluted with freshly boiled water, and stored in a polyethylene bottle with a guard tube containing a CO₂ absorbent. Glass is avoided because concentrated base slowly attacks it.
Hydrochloric acid is stable and is standardized against dried sodium carbonate or TRIS. With sodium carbonate the solution is boiled near the endpoint to drive off CO₂, which otherwise forms a carbonic acid buffer that blurs the endpoint.
Worked problem
Standardizing HCl with sodium carbonate
A 0.2365 g sample of dried Na₂CO₃ (105.99 g/mol) requires 44.12 mL of HCl to reach the second (methyl red) endpoint, and a blank requires 0.03 mL. Find the HCl concentration.
Show solution
- Reaction: CO₃²⁻ + 2H⁺ → H₂CO₃ (→ CO₂ + H₂O).
- mol Na₂CO₃ = 0.2365/105.99 = 2.2313 × 10⁻³ mol; mol HCl = 4.4627 × 10⁻³ mol.
- Volume corrected for the blank: 44.12 − 0.03 = 44.09 mL.
- c(HCl) = 4.4627 × 10⁻³/0.04409 = 0.10122 M.
Answer: 0.1012 M HCl.
An exact equation for titration curves
Rather than calculating each region of a titration curve with a different approximation, we can derive one equation that holds everywhere. Consider titrating a volume Va of a weak acid HA of concentration Ca with strong base NaOH of concentration Cb. After adding Vb of base, the charge balance is [H⁺] + [Na⁺] = [OH⁻] + [A⁻]. Substituting [Na⁺] = CbVb/(Va + Vb) and [A⁻] = α_A⁻ × CaVa/(Va + Vb) and rearranging gives the fraction of the way to the equivalence point, φ = CbVb/(CaVa):
This is the inverse of what we usually want, but that is a feature: choose a pH, compute [H⁺], [OH⁻] and α_A⁻, and the equation gives φ, and therefore the volume, with no approximations at all. Plotting pH against Vb traces the whole curve, including the regions near the start and near the equivalence point where the textbook approximations fail. For a strong acid, set α_A⁻ = 1. For a polyprotic acid, replace α_A⁻ by the average number of protons removed per molecule, α_HA⁻ + 2α_A²⁻ + …, and φ runs to 2 or 3. For a base titrated with acid, the equation has the same structure with signs reversed. Robert de Levie popularized this approach in analytical chemistry teaching.
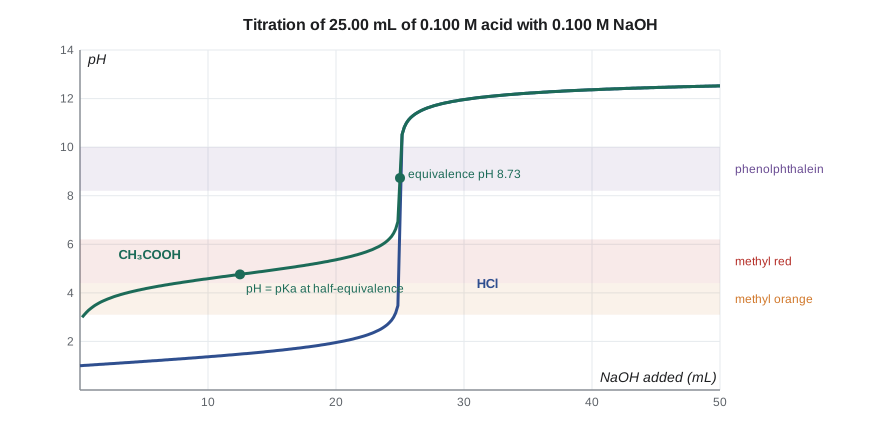
The curves show the features you know from CHEM-102, now with exact values. For the strong acid, the pH changes by more than 7 units within ±0.1 mL of the equivalence point, so any indicator changing between pH 4 and 10 gives a negligible titration error. For acetic acid, the buffer region holds the pH near pKa, the half-equivalence point gives pH = pKa = 4.76 exactly, and the equivalence point lies at pH 8.73, where only acetate remains. The steep rise is shorter, so the indicator must change in the basic range: phenolphthalein is right and methyl red would give a large error.
import math
KW = 1.0e-14

def alpha_bar(Ka, h):
    """Average number of protons removed per molecule of a polyprotic acid."""
    terms, p = [1.0], 1.0
    for K in Ka:
        p *= K / h
        terms.append(p)
    tot = sum(terms)
    return sum(j * t for j, t in enumerate(terms)) / tot

def volume_for_pH(pH, Ka, Ca, Va, Cb):
    h = 10 ** -pH; d = h - KW / h
    phi = (alpha_bar(Ka, h) - d / Ca) / (1 + d / Cb)
    return phi * Ca * Va / Cb

def pH_at_volume(Vb, Ka, Ca, Va, Cb):
    lo, hi = 0.0, 14.0
    for _ in range(80):
        mid = (lo + hi) / 2
        if volume_for_pH(mid, Ka, Ca, Va, Cb) < Vb: lo = mid
        else: hi = mid
    return mid

acetic = [10 ** -4.76]
strong = [1e3]                     # Ka so large the acid is fully dissociated
for Vb in (0.0, 5.0, 12.5, 20.0, 24.0, 24.9, 25.0, 25.1, 26.0, 30.0):
    a = pH_at_volume(Vb, acetic, 0.100, 25.0, 0.100)
    s = pH_at_volume(Vb, strong, 0.100, 25.0, 0.100)
    print(f"{Vb:5.1f} mL NaOH   HCl pH {s:5.2f}   acetic acid pH {a:5.2f}")
print(f"methyl red endpoint (pH 5.0) for acetic acid at {volume_for_pH(5.0, acetic, 0.1, 25.0, 0.1):.2f} mL")
print(f"phenolphthalein endpoint (pH 9.0) at {volume_for_pH(9.0, acetic, 0.1, 25.0, 0.1):.3f} mL")0.0 mL NaOH HCl pH 1.00 acetic acid pH 2.88 5.0 mL NaOH HCl pH 1.18 acetic acid pH 4.16 12.5 mL NaOH HCl pH 1.48 acetic acid pH 4.76 20.0 mL NaOH HCl pH 1.95 acetic acid pH 5.36 24.0 mL NaOH HCl pH 2.69 acetic acid pH 6.14 24.9 mL NaOH HCl pH 3.70 acetic acid pH 7.16 25.0 mL NaOH HCl pH 7.00 acetic acid pH 8.73 25.1 mL NaOH HCl pH 10.30 acetic acid pH 10.30 26.0 mL NaOH HCl pH 11.29 acetic acid pH 11.29 30.0 mL NaOH HCl pH 11.96 acetic acid pH 11.96 methyl red endpoint (pH 5.0) for acetic acid at 15.86 mL phenolphthalein endpoint (pH 9.0) at 25.004 mL
The last two lines quantify the titration error. Stopping at pH 5.0 with methyl red would end the acetic acid titration at about 15.9 mL, an error of more than a third. Stopping at pH 9.0 with phenolphthalein ends it within a few hundredths of a millilitre of 25.00 mL.
How small can Ka be?
As Ka decreases, the buffer region rises and the jump at the equivalence point shrinks. A useful rule is that a weak acid can be titrated accurately with a colour indicator if C_aKa is at least about 10⁻⁸; for 0.1 M analyte that means Ka ≥ 10⁻⁷. Boric acid (Ka = 5.8 × 10⁻¹⁰) is too weak to titrate directly, but adding mannitol or glycerol forms a complex that is a much stronger acid, a classic trick. Similarly, a very weak base such as pyridine cannot be titrated in water but can be in a nonaqueous solvent such as glacial acetic acid, which is how many pharmaceutical amines are assayed.
Polyprotic acids and mixtures
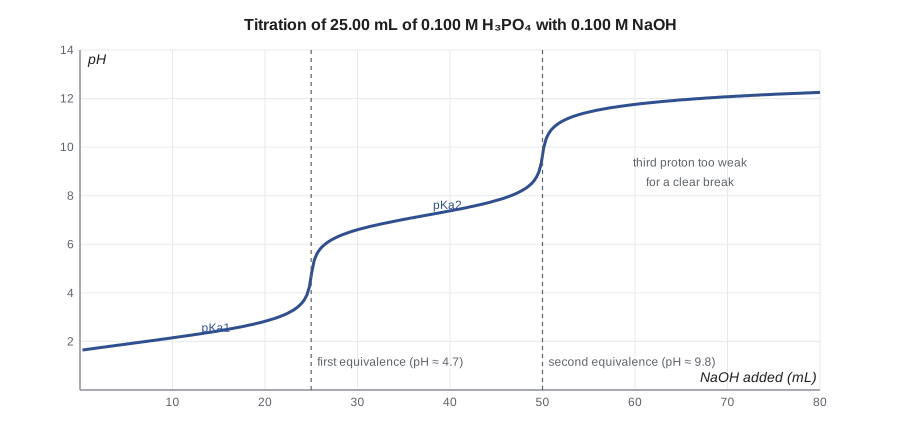
A polyprotic acid gives a separate equivalence point for each proton if successive Ka values differ by a factor of about 10⁴ or more. Phosphoric acid gives two clear breaks, at pH ≈ 4.7 and 9.8 (the amphiprotic pH values from lesson 7). The third proton (pK₃ = 12.35) is too weak to give a usable break in water.
The same idea analyzes mixtures. A solution containing NaOH and Na₂CO₃ (or Na₂CO₃ and NaHCO₃) titrated with HCl shows a phenolphthalein endpoint near pH 8.3, when hydroxide is neutralized and carbonate converted to bicarbonate, and a methyl orange or bromocresol green endpoint near pH 4.5, when bicarbonate is converted to carbonic acid. The volumes to the two endpoints reveal the composition. This is the basis of the alkalinity determination in water.
Indicators
An acid–base indicator is itself a weak acid or base whose acid and base forms have different colours. For an indicator HIn,
The eye sees mainly the acid colour when [HIn]/[In⁻] is above about 10 and mainly the base colour when it is below about 0.1, so the visible transition spans roughly pK_In ± 1. The indicator must be used in small amounts, because it consumes titrant too; that is what the blank titration corrects for.
| Indicator | Transition pH range | Colour change (acid to base) | Typical use |
|---|---|---|---|
| Thymol blue (first) | 1.2–2.8 | red to yellow | Strong acids with strong bases at low pH |
| Methyl orange | 3.1–4.4 | red to orange | Strong acid titrations, total alkalinity |
| Bromocresol green | 3.8–5.4 | yellow to blue | Total alkalinity, weak bases |
| Methyl red | 4.4–6.2 | red to yellow | Weak bases (ammonia), HCl with Na₂CO₃ |
| Bromothymol blue | 6.0–7.6 | yellow to blue | Strong acid–strong base |
| Phenolphthalein | 8.0–9.6 | colourless to pink | Weak acids with NaOH, KHP standardization |
| Thymolphthalein | 9.3–10.5 | colourless to blue | Weaker acids |
Choose an indicator whose transition range falls on the steep part of the curve, as close as possible to the equivalence-point pH. Mixed indicators (for example bromocresol green with methyl red) give sharper colour changes for demanding endpoints such as total alkalinity near pH 4.5.
Locating endpoints from pH data
A pH electrode can follow any titration, including coloured or turbid samples where an indicator cannot be seen, and it records the whole curve. The endpoint is the point of maximum slope, which can be found by computing the first derivative ΔpH/ΔV between successive points (its maximum marks the endpoint) or the second derivative (which crosses zero there). Autotitrators do this automatically.
A Gran plot uses the data before the endpoint, where the pH changes smoothly, and so avoids the noisy region around the jump. For a weak acid titrated with NaOH, rearranging the Ka expression shows that
approximately, where V_e is the equivalence volume. A plot of V_b·10^(−pH) against V_b is a straight line that reaches zero at V_b = V_e, and its slope gives −Ka (strictly −Ka γ_HA/γ_A⁻). Gran plots, introduced by Gunnar Gran in 1952, are especially valuable when the endpoint jump is small.
import math, random
# simulated pH titration of 25.00 mL of 0.1000 M acetic acid with 0.1000 M NaOH,
# with +/- 0.005 pH meter noise, then endpoints by derivative and by Gran plot
KW, Ka = 1.0e-14, 10 ** -4.76
def vol(pH, Ca=0.1, Va=25.0, Cb=0.1):
    h = 10 ** -pH; d = h - KW / h
    return (Ka / (Ka + h) - d / Ca) / (1 + d / Cb) * Ca * Va / Cb
def pH_at(V):
    lo, hi = 0.0, 14.0
    for _ in range(80):
        mid = (lo + hi) / 2
        lo, hi = (mid, hi) if vol(mid) < V else (lo, mid)
    return mid
rnd = random.Random(8)
V = [i * 0.5 for i in range(0, 46)] + [23.2 + 0.2 * i for i in range(0, 20)]
V = sorted(set(round(v, 2) for v in V))
pH = [pH_at(v) + rnd.gauss(0, 0.005) for v in V]
# first derivative between successive points
d1 = [((pH[i + 1] - pH[i]) / (V[i + 1] - V[i]), (V[i] + V[i + 1]) / 2) for i in range(len(V) - 1)]
best = max(d1)
print(f"first-derivative maximum at {best[1]:.2f} mL (slope {best[0]:.1f} pH/mL)")
# Gran plot from points between 10 and 22 mL
pts = [(v, v * 10 ** -p) for v, p in zip(V, pH) if 10 <= v <= 22]
n = len(pts); mx = sum(p[0] for p in pts) / n; my = sum(p[1] for p in pts) / n
m = sum((x - mx) * (y - my) for x, y in pts) / sum((x - mx) ** 2 for x, y in pts)
b = my - m * mx
print(f"Gran plot: Ve = {-b / m:.2f} mL, apparent Ka = {-m:.2e} (true {Ka:.2e})")first-derivative maximum at 24.90 mL (slope 9.4 pH/mL) Gran plot: Ve = 25.05 mL, apparent Ka = 1.72e-05 (true 1.74e-05)
The derivative method can locate the endpoint only to within the spacing of the data points, here 0.2 mL near the jump, and it is sensitive to noise in the steepest region. The Gran plot uses twenty readings taken well before the endpoint, where the pH is stable, and extrapolates to 25.05 mL; as a bonus its slope recovers Ka.
Application: alkalinity of water
Alkalinity is the capacity of a water to neutralize acid. In most natural waters it comes from bicarbonate, with carbonate and hydroxide at higher pH. It controls how strongly a water resists acidification, how corrosive it is to pipes, and how well coagulants work in water treatment. Alkalinity is determined by titrating with standard acid (often 0.02 N H₂SO₄ or 0.02 M HCl) to pH 8.3 (phenolphthalein alkalinity, P) and then to about pH 4.5 (total alkalinity, T), and is reported as mg/L of CaCO₃.
Worked problem
Total alkalinity
A 100.0 mL sample of well water from southern Manitoba has a pH of 7.9, so it shows no phenolphthalein endpoint. Titrated to pH 4.5 with 0.02000 M HCl, it requires 26.35 mL. Find the total alkalinity.
Show solution
- mol H⁺ = 0.02635 L × 0.02000 M = 5.270 × 10⁻⁴ mol.
- Each mole of CaCO₃ would neutralize 2 mol H⁺, so equivalent CaCO₃ = 2.635 × 10⁻⁴ mol = 26.37 mg.
- In 100.0 mL: 263.7 mg/L as CaCO₃.
Answer: 264 mg/L as CaCO₃, all bicarbonate since P = 0; a moderately high value typical of groundwater from carbonate rocks and glacial deposits.
Application: Kjeldahl nitrogen
Johan Kjeldahl, working at the Carlsberg Laboratory in Copenhagen, published his method for organic nitrogen in 1883, and it remains a reference method for protein. The sample is digested in hot concentrated sulfuric acid with a catalyst, converting organic nitrogen to ammonium sulfate. The digest is made strongly basic, the ammonia is distilled into a boric acid solution (or a measured excess of standard acid), and the ammonia is titrated with standard HCl to a methyl red or mixed-indicator endpoint. The protein content is found by multiplying the nitrogen mass fraction by a factor, 6.25 for most foods (because typical proteins contain about 16 % nitrogen), 6.38 for dairy products and 5.70 for wheat. Because the method measures nitrogen, not protein, it can be fooled by nitrogen-rich adulterants, as the melamine contamination of milk products in 2008 tragically demonstrated.
Worked problem
Protein by Kjeldahl
A 0.9814 g sample of feed is digested and distilled into boric acid; the ammonia requires 21.47 mL of 0.1012 M HCl, and a reagent blank requires 0.22 mL. Find the mass fraction of protein (factor 6.25).
Show solution
- Net volume = 21.25 mL; mol N = 0.02125 × 0.1012 = 2.1505 × 10⁻³ mol.
- Mass N = 2.1505 × 10⁻³ × 14.007 = 0.030122 g; mass fraction N = 0.030122/0.9814 = 3.069 %.
- Protein = 6.25 × 3.069 % = 19.2 %.
Answer: 19.2 % protein.
Common mistakes
MistakeThe endpoint and the equivalence point are the same thing.
InsteadThe equivalence point is stoichiometric; the endpoint is observed. Their difference is the titration error.
MistakeUse methyl red for acetic acid with NaOH.
InsteadThe equivalence point is near pH 8.7; methyl red changes near pH 5 and would end the titration far too early.
MistakeStore NaOH titrant in an open glass bottle.
InsteadIt absorbs CO₂ and attacks glass; use a capped polyethylene bottle with a CO₂ guard.
MistakeEvery proton of a polyprotic acid gives a break.
InsteadOnly if successive Ka values differ by about 10⁴ and the proton is not too weak.
MistakeForget the blank titration.
InsteadSubtract the titrant used by the indicator and reagents.
MistakeReport alkalinity in mol/L of HCO₃⁻.
InsteadBy convention alkalinity is reported as mg/L of CaCO₃, with 2 mol H⁺ per mol CaCO₃.
Summary and key terms
- Titrants are standardized against primary standards: NaOH with KHP, HCl with Na₂CO₃ or TRIS.
- The fraction-titrated equation gives exact titration curves for strong, weak and polyprotic acids.
- Weak acids can be titrated with indicators if CaKa ≥ about 10⁻⁸; polyprotic acids give separate breaks if successive Ka values differ by about 10⁴.
- Indicators change over about pK_In ± 1; choose one whose range lies on the steep part of the curve.
- Endpoints from pH data are found by derivatives or Gran plots.
- Alkalinity (as mg/L CaCO₃) and Kjeldahl nitrogen are major applications.
- Equivalence point
- The point at which titrant and analyte have been mixed in exactly stoichiometric amounts.
- Endpoint
- The observed point, by indicator or instrument, at which a titration is stopped.
- Titration error
- The difference between the endpoint and the equivalence point.
- Carbonate error
- Error caused by carbonate absorbed by a basic titrant.
- Gran plot
- A linearized plot of pre-endpoint titration data that extrapolates to the equivalence volume.
- Alkalinity
- The acid-neutralizing capacity of water, reported as mg/L CaCO₃.
- Kjeldahl method
- Determination of organic nitrogen by digestion, distillation of ammonia and titration.
Practice problems
Work each problem on paper first, then reveal the answer to check.
0.4512 g KHP requires 22.36 mL of NaOH. Find c(NaOH).
Show answer
0.4512/204.22 = 2.2094 × 10⁻³ mol; ÷ 0.02236 L = 0.09881 M.
Find the pH at the equivalence point when 50.00 mL of 0.0500 M formic acid (pKa 3.75) is titrated with 0.1000 M NaOH.
Show answer
Formate 0.0500 × 50/75 = 0.0333 M; Kb = 5.6 × 10⁻¹¹; [OH⁻] = √(1.87 × 10⁻¹²) = 1.37 × 10⁻⁶; pH 8.14.
Which indicator suits the titration of ammonia with HCl (equivalence pH about 5.3)?
Show answer
Methyl red (4.4–6.2).
A 100.0 mL water sample needs 3.10 mL of 0.0200 M HCl to pH 8.3 and 18.40 mL in total to pH 4.5. Find P and T alkalinity as mg/L CaCO₃.
Show answer
P: 3.10 × 0.0200/2 × 100.09/0.100 = 31.0 mg/L; T: 18.40 × 0.0200/2 × 100.09/0.100 = 184 mg/L.
Can 0.1 M phenol (Ka = 1.0 × 10⁻¹⁰) be titrated directly with NaOH using an indicator?
Show answer
CaKa = 10⁻¹¹, far below 10⁻⁸; no.
Why is the solution boiled near the endpoint when HCl is standardized against Na₂CO₃?
Show answer
To expel CO₂, which otherwise forms a carbonic acid buffer and blurs the endpoint.
Lesson quiz · 5 questions
Score 60% or more to complete this lesson.
Create a free account to save your progress, take quizzes and earn a certificate.