
CHEM-211 · Lesson 1 of 12 · 27 min
What analytical chemistry is: the analytical process
Every day, analytical chemists answer questions that matter to someone. Is the lead in this school's drinking water below the guideline? How much active ingredient is in this batch of tablets? Has the nitrate in a farm well risen since last spring? Is this athlete's urine sample clean? Did the mine's effluent meet its permit last month? Each question ends in a number, and each number carries consequences: a boil-water advisory, a recalled product, a fine, a disqualification, or a family's decision to buy a filter. Analytical chemistry is the science of obtaining such numbers, knowing how good they are, and reporting them so that people can act on them.
This course builds on the stoichiometry, equilibrium, acid–base and electrochemistry you met in CHEM-101 and CHEM-102. There, a titration was mainly an exercise in moles. Here it becomes a measurement with an uncertainty, a choice among methods, and part of a quality system. By the end of the course you will be able to plan an analysis, carry out the classical wet-chemical methods (acid–base, complexometric, precipitation and redox titrations, and gravimetry), treat the data statistically, and defend the result in a written report.
Qualitative and quantitative analysis
Analytical chemistry has two broad branches. Qualitative analysis asks what is present: is there chloride in this solution, is this white powder caffeine or something else, which pesticide residues are on this lettuce? Quantitative analysis asks how much: what is the mass fraction of iron in this ore, what is the concentration of fluoride in this tap water? Most modern work is quantitative, and it is the focus of this course, although every quantitative method assumes you already know the identity of what you are measuring.
The substance being measured is the analyte. Everything else in the sample is the matrix. Iron in a vitamin tablet is the analyte; the starch, sugar coating, binder and other minerals are the matrix. Matrix components that respond to the method as if they were the analyte, or that suppress or enhance its signal, are called interferences. A method's ability to measure the analyte without interference from the matrix is its selectivity, and much of the art of analytical chemistry lies in achieving it, either by choosing a selective reaction or by separating the analyte from the interferences before measurement.
Classical and instrumental methods
Classical methods, also called wet-chemical methods, rely on chemical reactions and on measurements of mass and volume. Gravimetric analysis weighs a pure product formed from the analyte; titrimetric (volumetric) analysis measures the volume of a reagent of known concentration that reacts exactly with the analyte. These methods developed in the eighteenth and nineteenth centuries and are still in daily use, because they can be very accurate and need no calibration curve: the result follows directly from stoichiometry and from masses traceable to the kilogram. Many reference materials are still certified by titration or gravimetry.
Instrumental methods measure a physical property that depends on the analyte's amount: absorption or emission of light, an electrode potential, a current, a mass-to-charge ratio, or the time a compound takes to pass through a chromatographic column. They are usually faster, more sensitive and better at handling many samples, but nearly all are relative: the instrument must be calibrated with standards of known concentration. CHEM-311 Instrumental Analysis develops these methods. In this course we use the simplest instrumental measurements, pH and absorbance, to illustrate calibration and to follow titrations.
| Method family | What is measured | Typical use | Calibration needed? |
|---|---|---|---|
| Gravimetric | Mass of a pure precipitate or residue | Sulfate, chloride, moisture, ash | No (stoichiometric) |
| Titrimetric | Volume of titrant of known concentration | Acidity, hardness, chloride, vitamin C | Titrant standardized against a primary standard |
| Potentiometric | Electrode potential (pH, ion-selective) | pH, fluoride, endpoint detection | Yes, with buffers or standards |
| Spectrophotometric | Absorbance of light | Iron, phosphate, nitrate, proteins | Yes, calibration curve |
| Chromatographic | Detector response over time | Pesticides, drugs, organic pollutants | Yes, standards for each compound |
The analytical process
An analysis is much more than the measurement step. Analytical chemists describe it as a sequence of decisions and operations, each of which can introduce error. The figure shows the process as a loop, because results that fail quality checks send the analyst back to an earlier step.
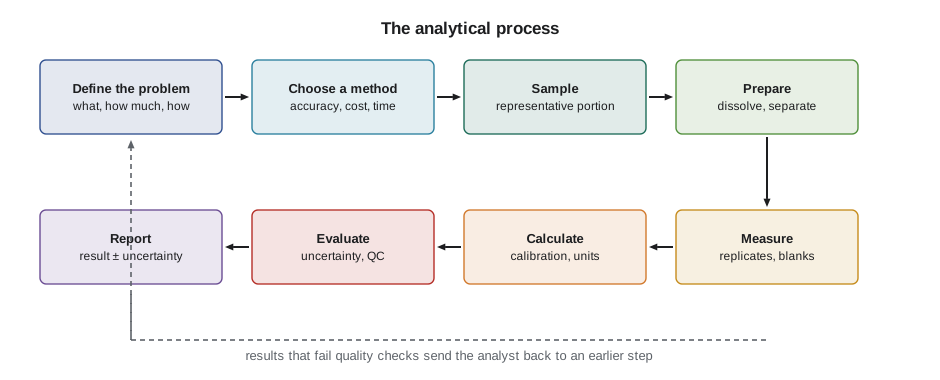
1. Define the problem. What is the question behind the request? Which analyte, in what kind of sample, at what concentration, with what accuracy, how fast and at what cost? A request for the arsenic in rice for a regulatory decision needs a validated method with a low detection limit; a quick screen of a hundred soil samples for gross contamination needs speed more than exactness. Talking to the client before starting saves more mistakes than any statistical test.
2. Choose a method. Match the method's sensitivity, selectivity, accuracy, speed and cost to the problem. Standard methods published by bodies such as ASTM International, the International Organization for Standardization (ISO), the American Public Health Association (Standard Methods for the Examination of Water and Wastewater) and national regulators are often required for regulatory work.
3. Obtain a representative sample. The result can be no better than the sample. A grab of the top centimetre of a grain truck, or tap water collected after the tap has run for ten minutes when the question is about lead standing in the pipes overnight, gives a precise answer to the wrong question. Sampling plans specify where, when and how much to collect, how to store it and how long it can be held.
4. Prepare the sample. Most samples must be dried, ground, weighed, dissolved or digested, and sometimes the analyte must be separated from interferences or concentrated. Losses, contamination and incomplete dissolution at this stage are common sources of error.
5. Measure. Carry out the measurement on replicate portions, usually three or more, along with blanks (samples with no analyte, carried through every step) and check standards.
6. Calculate. Convert the raw signal into the quantity requested, using stoichiometry or a calibration, and keep track of units and dilutions.
7. Evaluate. Estimate the uncertainty, test for outliers, compare replicates, and check quality-control results. Are they good enough to answer the question?
8. Report. State the result with its uncertainty, the method, and any limitations, in a form the client can use.
Worked problem
Planning an analysis
A small town in Manitoba asks whether the lead concentration in drinking water at its elementary school is below the Health Canada guideline of 0.005 mg/L. Outline the decisions in steps 1 to 4.
Show solution
- Define: the analyte is dissolved plus particulate lead in water as drunk; the decision threshold is about 5 to 10 µg/L, so the method must measure well below that, ideally to 1 µg/L or less; the result decides whether to replace fixtures or service lines.
- Method: classical titrations cannot reach µg/L levels, so an instrumental method is needed, typically inductively coupled plasma mass spectrometry (ICP-MS) following a standard method, in an accredited laboratory.
- Sample: collect first-draw samples after water has stood in the pipes for at least six hours (the worst case for a child drinking in the morning), plus flushed samples to locate the source, from every drinking fountain and kitchen tap. Use clean plastic bottles and acidify with nitric acid to keep lead in solution.
- Prepare: digest the acidified sample so particulate lead dissolves, and include field blanks and laboratory blanks to detect contamination.
Answer: The problem definition drives everything else: the low threshold rules out classical methods, and the health question dictates first-draw sampling.
Absolute and relative methods
An absolute method gives the amount of analyte from fundamental quantities: mass, volume, stoichiometry and atomic masses. Gravimetry and titration with a standardized titrant are absolute in this sense. A relative method compares the sample's signal with the signals of standards. Spectrophotometry, chromatography and most electrochemical methods are relative. The distinction matters for traceability: an absolute method inherits its accuracy from the balance and the glassware, while a relative method inherits it from the standards, and errors in the standards pass straight into every result.
Units of concentration
Analytical results are reported in many units, and conversion errors are among the most common mistakes in practice. The table collects the units you will use most.
| Unit | Definition | Typical use |
|---|---|---|
| Molarity (M) | mol of solute per litre of solution | Titrants, buffers, equilibrium calculations |
| Formal concentration (F) | mol of formula units added per litre, regardless of dissociation | Weak acids and salts as prepared |
| Mass fraction (g/g, %) | mass of analyte per mass of sample | Ores, foods, pharmaceuticals |
| mg/L | mass of analyte per litre of solution | Drinking water, wastewater |
| ppm, ppb (mass basis) | µg/g and ng/g; for dilute water, ppm ≈ mg/L and ppb ≈ µg/L | Trace metals, pesticides |
| mg/L as CaCO₃ | amount expressed as the mass of CaCO₃ that would contain it | Hardness and alkalinity |
Parts per million and parts per billion are convenient but ambiguous, because they can be on a mass, volume or mole basis. In water analysis, 1 L of dilute solution has a mass of almost exactly 1 kg, so 1 mg/L is 1 mg per 10⁶ mg, or 1 ppm by mass. For gases, ppm usually means a volume (mole) ratio. Always state the basis, and prefer mg/L or µg/L for water.
Worked problem
Converting units
A water sample contains 52.0 mg/L of calcium. Express this as molarity and as hardness in mg/L as CaCO₃.
Show solution
- Molarity: 52.0 mg/L ÷ 40.078 g/mol = 1.30 × 10⁻³ mol/L = 1.30 mM.
- As CaCO₃: each mole of Ca²⁺ corresponds to one mole of CaCO₃ (100.09 g/mol), so 1.30 × 10⁻³ mol/L × 100.09 g/mol = 0.130 g/L = 130 mg/L as CaCO₃.
- Shortcut: multiply mg/L of Ca by 100.09/40.08 = 2.497.
Answer: 1.30 mM, or 130 mg/L as CaCO₃.
# Unit conversions an analyst does every day
M = {'Ca': 40.078, 'Mg': 24.305, 'CaCO3': 100.087, 'Fe': 55.845, 'NO3': 62.004, 'N': 14.007}

def mg_per_L_to_mM(mg_L, species):
    return mg_L / M[species]

def as_CaCO3(mg_L, species):
    # hardness: one mol of a divalent cation corresponds to one mol of CaCO3
    return mg_L / M[species] * M['CaCO3']

ca, mg = 52.0, 14.6
hard = as_CaCO3(ca, 'Ca') + as_CaCO3(mg, 'Mg')
print(f"Ca {ca} mg/L = {mg_per_L_to_mM(ca, 'Ca'):.3f} mM = {as_CaCO3(ca, 'Ca'):.0f} mg/L as CaCO3")
print(f"Mg {mg} mg/L = {mg_per_L_to_mM(mg, 'Mg'):.3f} mM = {as_CaCO3(mg, 'Mg'):.0f} mg/L as CaCO3")
print(f"total hardness = {hard:.0f} mg/L as CaCO3")

# nitrate is often reported as nitrate-N; convert 10 mg/L as N to mg/L as nitrate
print(f"10.0 mg/L nitrate-N = {10.0 * M['NO3'] / M['N']:.1f} mg/L as nitrate")Ca 52.0 mg/L = 1.297 mM = 130 mg/L as CaCO3 Mg 14.6 mg/L = 0.601 mM = 60 mg/L as CaCO3 total hardness = 190 mg/L as CaCO3 10.0 mg/L nitrate-N = 44.3 mg/L as nitrate
The last line shows a classic trap. Nitrate guidelines are often written as nitrate-nitrogen (10 mg/L as N in both Canada and the United States), which is equivalent to about 45 mg/L as nitrate ion. A laboratory that reports 30 mg/L without saying which form has given an answer that could be read as safe or unsafe.
Figures of merit
Methods are compared by figures of merit, numbers that describe how well a method performs. You will meet each of them in detail later in the course.
| Figure of merit | Question it answers | Lesson |
|---|---|---|
| Accuracy (bias) | How close is the result to the true value? | 3, 12 |
| Precision | How close are replicate results to each other? | 3, 4 |
| Sensitivity | How much does the signal change per unit concentration? | 5 |
| Detection limit | What is the smallest amount that can be distinguished from a blank? | 5 |
| Linear range | Over what concentrations is the response proportional? | 5 |
| Selectivity | How free is the method from interferences? | 1, 9, 12 |
| Robustness | Does the result survive small changes in conditions? | 12 |
A brief history
Quantitative chemistry began when chemists started to weigh. Antoine Lavoisier's careful balance work in the 1770s and 1780s, showing that mass is conserved in reactions, made chemistry a quantitative science. Gravimetric analysis flourished in the nineteenth century, when Jöns Jacob Berzelius determined atomic masses of many elements with remarkable accuracy, and Theodore Richards later refined them so well that he received the 1914 Nobel Prize in Chemistry. Titration developed alongside: Joseph Louis Gay-Lussac published a volumetric method for silver in 1832 and introduced the words burette and pipette in the 1820s, Karl Friedrich Mohr designed the burette with a pinchcock and published his influential textbook on titration in 1855, and Jacob Volhard described his back-titration for silver and halides in 1874. Statistics entered the laboratory in the twentieth century: William Sealy Gosset, publishing as Student in 1908 while working at the Guinness brewery in Dublin, gave analysts the t distribution for small samples, and Walter Shewhart's control charts of 1924 created statistical quality control.
Analytical chemistry and society
Most analytical results are used to make decisions, and many decisions are written into regulations. Drinking-water guidelines, food standards, workplace exposure limits and environmental permits all set numerical limits, and only analytical measurements can show whether they are met. Because the stakes are high, laboratories that produce results for regulatory or legal use are usually accredited to the international standard ISO/IEC 17025, which requires documented methods, trained staff, calibrated equipment, traceable standards, quality-control records and participation in proficiency tests. Lesson 12 returns to this system.
In Canada, Health Canada publishes the Guidelines for Canadian Drinking Water Quality, which the provinces and territories adopt into their own regulations, and the Canadian Council of Ministers of the Environment (CCME) publishes environmental quality guidelines. Laboratories are commonly accredited by the Canadian Association for Laboratory Accreditation (CALA) or the Standards Council of Canada. Lead is a good example of how analytical capability and health knowledge move together: Health Canada lowered its maximum acceptable concentration for lead from 0.010 mg/L to 0.005 mg/L in 2019, a level that requires methods able to measure reliably at about 1 µg/L.
Safety in the analytical laboratory
Analytical work uses corrosive acids and bases, oxidizers, toxic metal salts and sometimes flammable solvents, usually in small amounts but repeatedly. The habits from CHEM-101 apply every day: wear eye protection and a lab coat, read the safety data sheet before using a new reagent, add acid to water rather than water to acid when diluting, never pipette by mouth, label every container with its contents and date, and dispose of metal-containing and halogenated wastes in the designated containers rather than down the drain. Silver, mercury, chromium(VI) and lead reagents deserve special care, and modern methods are chosen partly to avoid them.
Common mistakes
MistakeAnalytical chemistry is just the measurement step.
InsteadThe measurement is one of eight steps; sampling and sample preparation often contribute more error than the instrument.
MistakeA precise result must be accurate.
InsteadReplicates can agree closely and all be wrong because of a systematic error such as a bad standard or an interference.
Mistakeppm always means mg/L.
InsteadOnly for dilute aqueous solutions on a mass basis; for gases ppm is usually a volume ratio, and for solids it means µg/g.
MistakeNitrate at 30 mg/L exceeds the 10 mg/L guideline.
InsteadThe guideline is 10 mg/L as nitrate-N, about 45 mg/L as nitrate ion; check which form is reported.
MistakeInstrumental methods have replaced titration and gravimetry.
InsteadClassical methods remain essential for high-accuracy work and for certifying the standards that instruments are calibrated with.
Summary and key terms
- Analytical chemistry obtains qualitative and quantitative information about samples and estimates how reliable that information is.
- The analyte is measured in a matrix; interferences reduce selectivity.
- Classical (gravimetric and titrimetric) methods are absolute; most instrumental methods are relative and need calibration.
- The analytical process runs from defining the problem through method choice, sampling, preparation, measurement, calculation and evaluation to reporting.
- Concentration units must be stated with their basis; hardness is expressed as mg/L of CaCO₃ and nitrate often as nitrogen.
- Figures of merit (accuracy, precision, sensitivity, detection limit, linear range, selectivity, robustness) describe method performance.
- Regulatory results come from accredited laboratories working under ISO/IEC 17025.
- Analyte
- The species whose identity or amount is being determined.
- Matrix
- Everything in the sample other than the analyte.
- Interference
- A substance that changes the signal for the analyte or gives a signal of its own.
- Selectivity
- The extent to which a method measures the analyte without response to other substances.
- Absolute method
- A method whose result follows from mass, volume and stoichiometry without calibration against standards.
- Relative method
- A method that compares the sample signal with signals from standards.
- Blank
- A sample containing no analyte, carried through the whole procedure to measure background and contamination.
- Figure of merit
- A quantitative measure of method performance, such as detection limit or precision.
Practice problems
Work each problem on paper first, then reveal the answer to check.
Identify the analyte and two matrix components in the determination of caffeine in an energy drink.
Show answer
Analyte: caffeine. Matrix: water, sugars, citric acid, taurine, colourings, preservatives and other dissolved substances.
A lake contains 0.25 mg/L of phosphorus. Express this in µg/L and in µmol/L.
Show answer
250 µg/L; 0.25 mg/L ÷ 30.974 g/mol = 8.1 µmol/L.
Water contains 35.0 mg/L Ca and 8.5 mg/L Mg. Find the total hardness as mg/L CaCO₃.
Show answer
Ca: 35.0 × 2.497 = 87.4; Mg: 8.5 × 100.09/24.305 = 35.0; total 122 mg/L as CaCO₃.
Why must lead samples be first-draw samples after overnight standing?
Show answer
Lead dissolves from pipes, solder and fixtures while water stands; first-draw water represents the highest exposure, which is what the guideline protects against.
Classify each method as absolute or relative: (a) chloride by weighing AgCl; (b) iron by absorbance of its phenanthroline complex; (c) acidity by titration with standardized NaOH.
Show answer
(a) absolute; (b) relative; (c) absolute, once the NaOH has been standardized against a primary standard.
A sample contains 4.5 mg/L nitrate-N. Express it as nitrate ion.
Show answer
4.5 × 62.00/14.01 = 19.9 mg/L as nitrate.
Lesson quiz · 5 questions
Score 60% or more to complete this lesson.
Create a free account to save your progress, take quizzes and earn a certificate.