
CHE-260 · Lesson 12 of 12 · 22 min
Lab reports, data integrity and ISO/IEC 17025
At the end of his term in the QC lab, Theo has one more job: write up the propyl acetate investigation for the plant manager, the customer and the lab's quality file, and help Marisol prepare for the lab's accreditation audit. Neither task involves an instrument, and both matter as much as anything he has measured. A result that cannot be traced to its raw data, that comes without an uncertainty, or that sits in a report no one can follow is worth little to a customer or a regulator. This final lesson covers how labs record, check and report results so that they can be trusted, and the international standard that sets out what a competent laboratory must do.
Recording data
Every measurement starts as a record. In a paper notebook, entries are made directly in ink in a bound book with numbered pages, dated, and signed. Nothing is torn out or erased: a mistake is struck through with a single line so it stays legible, and the correction is initialled, dated and explained. Raw data, such as balance readings, burette volumes and instrument printouts, go into the record as they are produced, not copied later from scraps of paper. Most plant labs now use a laboratory information management system (LIMS) and instrument data systems, which capture results electronically, link them to the sample, the analyst, the instrument and the calibration, and keep an audit trail of every change.
The principles of good records are often summarized by the acronym ALCOA+. Data must be attributable to the person and instrument that produced them, legible, contemporaneous (recorded when the work is done), original (the first record, or a certified true copy), and accurate. The plus adds complete (nothing left out, including failed runs), consistent (dated in sequence), enduring (kept for the required retention period) and available for review. These principles began in regulated pharmaceutical labs but apply to any lab whose results support commercial or legal decisions.
Data integrity
Data integrity means that results are complete, consistent and accurate throughout their life, and it is threatened as much by pressure as by error. A technician who reruns a failing sample until it passes and reports only the passing result, who deletes an inconvenient chromatogram, or who reintegrates peaks by hand to move a result inside a limit, has falsified data, whatever the intention. Electronic systems help by preventing deletion, requiring reasons for reintegration and keeping audit trails that reviewers check. Culture matters most: a lab where analysts can report a failure without fear, and where supervisors ask how a result was obtained rather than only whether it passed, produces honest data.
| Practice | Acceptable | Not acceptable |
|---|---|---|
| Repeating a test | Following a written procedure that says when and how often to retest, reporting according to that rule | Retesting until a passing result appears and reporting only that one |
| Rejecting an outlier | Documenting a cause or applying a stated statistical test | Deleting a result because it looks wrong |
| Integrating peaks | Using validated automatic settings; manual changes reviewed and justified | Adjusting baselines by hand to change a result |
| Correcting a record | Single-line strike-through, initialled, dated and explained | Erasing, overwriting or rewriting the page |
Measurement uncertainty
Every result has an uncertainty, a range within which the true value is believed to lie with stated confidence. The internationally recognized approach, set out in the Guide to the Expression of Uncertainty in Measurement (GUM), builds an uncertainty budget. Each source of uncertainty is listed and estimated as a standard uncertainty: from the statistics of repeated measurements (Type A evaluation) or from other information such as calibration certificates, glassware tolerances or published data (Type B evaluation). For a result calculated by multiplying and dividing quantities, the relative standard uncertainties combine as the root sum of squares:
The combined standard uncertainty is multiplied by a coverage factor k, usually 2, to give an expanded uncertainty U that corresponds to roughly 95 percent confidence. The result is reported as \(y \pm U\) with the value of k stated. Building a budget also shows where to improve: the largest contributor dominates, so reducing a small one achieves little.
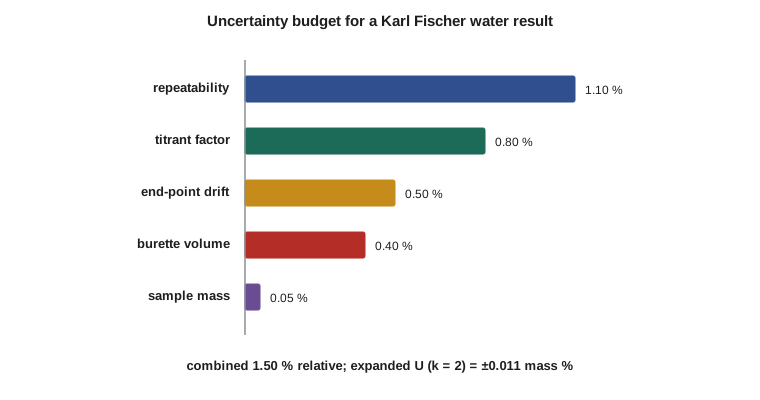
The program below combines Theo's uncertainty budget for a Karl Fischer water result and checks a run of control-chart results with the rules from Lesson 3.
# Uncertainty budget for a Karl Fischer water result, and control chart checks
import math
# 1. Combine standard uncertainties (relative) by root sum of squares
result = 0.350   # water, mass %
budget = {
    'titrant factor (standardization)': 0.0080,
    'sample mass (balance)': 0.0005,
    'burette volume': 0.0040,
    'repeatability (6 replicates)': 0.0110,
    'end-point drift correction': 0.0050,
}
uc_rel = math.sqrt(sum(u * u for u in budget.values()))
for k, u in sorted(budget.items(), key=lambda kv: -kv[1]):
    share = u * u / uc_rel ** 2
    print(f"{k:34s} {u * 100:5.2f} %  ({share:4.0%} of variance)")
U = 2 * uc_rel * result
print(f"combined relative u = {uc_rel * 100:.2f} %, expanded U (k = 2) = {U:.3f} mass %")
print(f"report: water = {result:.3f} +/- {U:.3f} mass % (k = 2)")

# 2. Control chart for a check standard (target 0.500 vol% methanol, s = 0.008)
target, s = 0.500, 0.008
runs = [0.503, 0.497, 0.509, 0.512, 0.511, 0.514, 0.518, 0.495, 0.526]
for i, x in enumerate(runs, 1):
    z = (x - target) / s
    flag = ''
    if abs(z) > 3: flag = 'reject: beyond 3 s'
    elif abs(z) > 2: flag = 'warning: beyond 2 s'
    print(f"run {i}: {x:.3f}  z = {z:+.1f}  {flag}".rstrip())
# four results in a row more than 1 s on the same side signals a shift
for i in range(3, len(runs)):
    window = runs[i - 3:i + 1]
    if all((r - target) / s > 1 for r in window):
        print(f"runs {i - 2}-{i + 1}: four in a row above +1 s, look for a systematic shift")
breakrepeatability (6 replicates) 1.10 % ( 53% of variance) titrant factor (standardization) 0.80 % ( 28% of variance) end-point drift correction 0.50 % ( 11% of variance) burette volume 0.40 % ( 7% of variance) sample mass (balance) 0.05 % ( 0% of variance) combined relative u = 1.50 %, expanded U (k = 2) = 0.011 mass % report: water = 0.350 +/- 0.011 mass % (k = 2) run 1: 0.503 z = +0.4 run 2: 0.497 z = -0.4 run 3: 0.509 z = +1.1 run 4: 0.512 z = +1.5 run 5: 0.511 z = +1.4 run 6: 0.514 z = +1.8 run 7: 0.518 z = +2.3 warning: beyond 2 s run 8: 0.495 z = -0.6 run 9: 0.526 z = +3.3 reject: beyond 3 s runs 3-6: four in a row above +1 s, look for a systematic shift
Repeatability and the titrant factor together supply over 80 percent of the variance. Standardizing the titrant more often and running duplicates would shrink the uncertainty; buying a better balance would not change it at all.
Decision rules
When a result is close to a specification limit, its uncertainty affects the decision. A water result of 0.98 ± 0.03 percent by volume against a limit of 1.0 percent might really be above the limit. A decision rule, agreed in advance with the customer, states how the lab handles such cases. Simple acceptance compares the result directly with the limit. A guarded rule requires the result to be below the limit by at least the expanded uncertainty before the lab states that the material conforms, which lowers the risk of passing bad material but rejects more borderline good material. Product specifications such as CAN/CGSB-3.516 usually define how results are compared with limits, and the lab states the rule it applies on its reports.
Certificates of analysis and technical reports
A certificate of analysis tells a customer what was measured and what was found. It identifies the laboratory, the sample and the material it represents, the date of sampling and testing, each test with its method and result, the specification limits, the uncertainty or decision rule where relevant, and the name of the person who authorized it. It reports results in the units and number of digits the specification uses, and it never reports a result the lab did not measure.
A technical report explains an investigation. Its structure is familiar from lab reports in earlier courses, but the audience is different: a plant manager or customer who needs the conclusion first. A good report opens with a short summary stating the problem, what was found and what is recommended. The introduction gives the background and the question. The methods section says what was sampled, how, and which methods were used, in enough detail for another analyst to repeat the work. The results section presents data in clear tables and figures with units and uncertainties. The discussion interprets the results, compares them with specifications or expectations and admits limitations. The conclusions and recommendations follow directly from the evidence. Plain language, consistent units and honest statements of uncertainty make a report credible.
Worked problem
Summarizing the propyl acetate investigation
Theo has found that railcar samples from a two-week period contain 15 to 40 mg/L propyl acetate, identified by GC-MS, while earlier shipments contained less than 2 mg/L. During the same period, the fermentation records show yeast stress and fusel oil levels about double normal. How should the summary of his report read?
Show solution
- State the problem: a customer reported an off-odour in fuel ethanol shipped during a defined period.
- State the finding with its evidence and uncertainty: the odour is attributed to propyl acetate at 15 to 40 mg/L, identified by GC-MS against a pure standard, compared with less than 2 mg/L in earlier shipments.
- State the probable cause, with appropriate caution: the increase coincides with stressed fermentations that doubled fusel oil production; propyl acetate forms from 1-propanol during distillation and storage.
- State the recommendations: add propyl acetate to the routine GC method, set an internal alert level, and review fermentation temperature control.
Answer: A four-sentence summary that a manager can read in thirty seconds, supported by the detailed sections behind it. The summary says the cause is probable, not proven, because the evidence is a correlation in time.
ISO/IEC 17025: competence of testing laboratories
ISO/IEC 17025, General requirements for the competence of testing and calibration laboratories, is the international standard against which labs are accredited. The current edition was published in 2017. Accreditation means an independent body, the Standards Council of Canada or the Canadian Association for Laboratory Accreditation at Kingfisher Bioenergy's location, has assessed the lab and found that it operates competently and produces valid results for the specific tests listed on its scope. Many customers, regulators and trading partners accept results only from accredited labs, and because accreditation bodies recognize each other through international arrangements, a result from an accredited lab in one country is accepted in others.
The standard's requirements fall into a few groups. Labs must act impartially and keep client information confidential. They must have competent staff, with documented training and authorization for each method; suitable facilities and environmental conditions; and equipment that is calibrated and maintained. Measurements must be metrologically traceable, linked through an unbroken chain of calibrations to national or international standards, which is why balances are checked with certified weights and standards are made from certified reference materials. Methods must be validated, or, for standard methods, verified, to show they work as intended in the lab's hands. Labs must evaluate measurement uncertainty, assure the validity of results through quality control and proficiency testing, report results clearly, handle complaints and nonconforming work, and run a management system with document control, internal audits and management review.
Method validation and proficiency testing
Validation shows that a method is fit for its intended purpose. For a quantitative method it typically examines selectivity (freedom from interferences), linearity and range, accuracy (from reference materials and spike recoveries), precision (repeatability and intermediate precision across days and analysts), the limits of detection and quantitation, and robustness (how sensitive the method is to small changes in conditions). A lab adopting a published standard method does a shorter verification, showing it can achieve the method's stated precision and accuracy.
Proficiency testing gives an external check. A provider sends the same sample to many labs, collects their results and reports each lab's performance as a z-score, \(z = (x - X)/\sigma_p\), where X is the assigned value and \(\sigma_p\) the standard deviation for proficiency assessment. A z-score within ±2 is satisfactory, between 2 and 3 in magnitude is questionable, and beyond 3 is unsatisfactory and requires investigation and corrective action. The lab's water results in last year's fuel ethanol scheme had z-scores of −0.4, 0.8 and 1.1, all satisfactory, and its copper result of z = 2.4 triggered an investigation that traced a slow contamination problem to a deteriorating sample bottle cleaning process.
Common mistakes
MistakeErasing or overwriting a mistake in a notebook.
InsteadStrike through with a single line, initial, date and explain the correction.
MistakeRetesting a failing sample until it passes and reporting only the pass.
InsteadFollow the written retest procedure and report results according to it, keeping every result in the record.
MistakeReporting a result without its uncertainty or decision rule when it is near a limit.
InsteadState the expanded uncertainty with k, and the decision rule agreed with the customer.
MistakeTreating accreditation as covering everything the lab does.
InsteadAccreditation covers only the specific tests and methods listed on the lab's scope.
Summary and key terms
- Records must be attributable, legible, contemporaneous, original and accurate, and also complete, consistent, enduring and available.
- Data integrity forbids selective reporting, unjustified deletion and manipulation of results; audit trails and a supportive culture protect it.
- Uncertainty budgets combine standard uncertainties by root sum of squares; the expanded uncertainty uses a coverage factor, usually k = 2.
- Decision rules state how results near a limit are judged, and are agreed with the customer in advance.
- Certificates and technical reports must identify sample, method, result, uncertainty and authorization, with conclusions first in reports.
- ISO/IEC 17025:2017 requires impartiality, competence, traceability, validated methods, uncertainty, quality assurance and a management system.
- Proficiency testing z-scores within ±2 are satisfactory; beyond ±3 require corrective action.
- LIMS
- A laboratory information management system that tracks samples, results and associated data.
- Audit trail
- A secure, time-stamped record of who created, changed or deleted electronic data and why.
- Data integrity
- The completeness, consistency and accuracy of data throughout its life.
- Measurement uncertainty
- A parameter that characterizes the dispersion of values that could reasonably be attributed to the measured quantity.
- Coverage factor
- The multiplier, usually 2, applied to combined standard uncertainty to give expanded uncertainty.
- Metrological traceability
- The property of a result being related to a reference through an unbroken, documented chain of calibrations.
- Accreditation
- Formal recognition by an independent body that a laboratory is competent to carry out specific tests.
- Proficiency testing
- Evaluation of a laboratory's performance by comparing its results on shared samples with those of other laboratories.
Practice problems
Work each problem on paper first, then reveal the answer to check.
Relative standard uncertainties of 0.6, 0.8 and 0.2 percent combine to what value?
Show answer
\(\sqrt{0.36 + 0.64 + 0.04} = 1.02\) percent.
A result is 2.50 mg/L with combined standard uncertainty 0.04 mg/L. Report it with k = 2.
Show answer
2.50 ± 0.08 mg/L (k = 2).
Which uncertainty contribution should a lab reduce first?
Show answer
The largest one, because variances add and the largest dominates the total.
A proficiency test gives an assigned value of 0.50, σp = 0.02, and the lab reports 0.55. What is the z-score and verdict?
Show answer
\(z = 2.5\), questionable; the lab should review the result.
Name three things a certificate of analysis must show.
Show answer
For example: the sample identity, each test method and result, the specification limits and the authorizing signature.
What is the difference between method validation and verification?
Show answer
Validation establishes that a method is fit for purpose; verification shows that a lab can achieve a published standard method's stated performance.
Lesson quiz · 5 questions
Score 60% or more to complete this lesson.
Create a free account to save your progress, take quizzes and earn a certificate.