
CHE-220 · Lesson 5 of 12 · 23 min
Generalized correlations for gases and liquids
Equations of state need parameters, and sometimes the parameters are all you have. When Ingrid's team sized the new ammonia refrigeration plant, they needed vapour densities at the compressor suction and discharge and liquid densities in the receiver. They also needed the density of hot ethanol-rich liquid in the distillation reflux drums, where a level instrument calibrated for the wrong density reads wrongly. Measured data exist for all of these fluids, but engineers also need methods that work from a handful of constants, both for quick checks and for fluids without good data. This lesson covers the generalized, or corresponding-states, correlations that do that job for gases and liquids.
The principle of corresponding states
Van der Waals noticed that if you express pressure, volume and temperature as fractions of their critical values, the PVT behaviour of many fluids looks nearly the same. That observation is the two-parameter theorem of corresponding states: all fluids, compared at the same reduced temperature and reduced pressure, have about the same compressibility factor. It works very well for simple, spherical molecules such as argon, krypton and methane, and reasonably for many others, but it cannot capture the differences caused by molecular shape and polarity.
Pitzer's three-parameter version adds the acentric factor from Lesson 2. The compressibility factor becomes a simple-fluid value plus a correction proportional to \(\omega\). Both functions, \(Z^0\) and \(Z^1\), are universal: the same tables or charts serve every fluid. This is the same structure as the Pitzer virial correlation in Lesson 3 and the Lee-Kesler vapour pressure correlation in Lesson 2, and it explains why so many correlations need only \(T_c\), \(P_c\) and \(\omega\).
The Lee-Kesler correlation
The most widely used tables of \(Z^0\) and \(Z^1\) come from the Lee-Kesler correlation of 1975, which fitted an elaborate equation of state with twelve constants to data for a simple fluid and for a heavy reference fluid. The resulting tables cover reduced temperatures from about 0.3 to 4 and reduced pressures up to 10, in both gas and liquid regions, and similar tables give generalized enthalpy and entropy departures. For non-polar and slightly polar gases, Lee-Kesler compressibility factors are usually within 2 to 3 percent of measured values, rather better than a cubic equation near the critical point.
Using the tables means double interpolation in reduced temperature and pressure, which is tedious by hand and easy in software. Many process simulators offer Lee-Kesler, or its extension to mixtures by Plöcker and coworkers, as an option for light hydrocarbon systems. For hand calculations, a practical route is to use the Pitzer virial correlation where \(Z\) stays above about 0.85, and a cubic equation of state or the tables elsewhere.
Reading a generalized chart
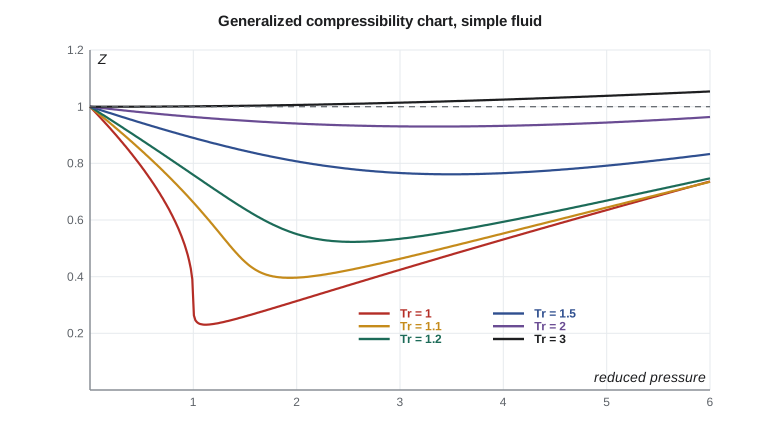
The chart shows the features that every engineer should recognize. All curves start at \(Z = 1\) at zero pressure, the ideal gas limit. Near the critical temperature, \(Z\) drops steeply as pressure rises toward the critical pressure, reaching values of about 0.25 to 0.3, because near-critical fluids are highly compressible: a small pressure change produces a large density change. At higher reduced temperatures, the dip is shallower, and above a reduced temperature of about 2.5 to 3, \(Z\) stays close to 1 and even rises above it at high pressures, as repulsion between molecules takes over. At very high reduced pressures, all curves rise with pressure for the same reason.
Two rules of thumb follow. A gas is close to ideal when its reduced pressure is small, say below 0.05, or when its reduced temperature is high, say above 2. And near the critical point, no simple correlation is reliable, so measured data or a reference equation should be used when accuracy matters. Nitrogen at room temperature has a reduced temperature of about 2.4, which is why it behaves almost ideally even at tens of bar. Carbon dioxide at room temperature has a reduced temperature of only about 0.97, which is why the liquefaction plant needs real-gas methods.
Worked problem
Ammonia vapour at the refrigeration compressor
The ammonia compressor takes saturated vapour at −10 °C and 2.9 bar and discharges it at 13.5 bar and about 110 °C. For ammonia, \(T_c = 405.7\ \text{K}\), \(P_c = 112.8\ \text{bar}\) and \(\omega = 0.253\) (approximate). Estimate \(Z\) and the density at both points with the Pitzer virial correlation, and check that it is valid.
Show solution
- Suction: \(T_r = 263.15/405.7 = 0.649\), \(P_r = 2.9/112.8 = 0.0257\). \(B^0 = 0.083 - 0.422/0.649^{1.6} = -0.761\); \(B^1 = 0.139 - 0.172/0.649^{4.2} = -0.921\).
- \(Z = 1 + (-0.761 + 0.253 \times -0.921)(0.0257/0.649) = 0.961\). Density \(= PM/(ZRT) = 2.9\times10^5 \times 0.01703/(0.961 \times 8.314 \times 263.15) = 2.35\ \text{kg/m}^3\).
- Discharge: \(T_r = 383.15/405.7 = 0.944\), \(P_r = 0.120\); the program gives \(Z = 0.949\) and a density of 7.60 kg/m³.
- Both values of \(Z\) are above 0.85, so the truncated virial equation is inside its range.
Answer: Ammonia vapour is about 4 to 5 percent denser than an ideal gas at both points. The compressor's volumetric flow, which sets its size, comes from the suction density, so a 4 percent error would mean a compressor 4 percent too small or too large. For the condenser inlet, at the same pressure but cooled to 35 °C, \(Z\) drops to about 0.89, still in range but closer to the limit.
Liquid densities: the Rackett equation
Cubic equations of state give poor liquid densities, as Lesson 4 showed. For saturated liquids, the Rackett equation is a simple and widely used alternative. It needs the critical volume and critical compressibility factor, and it captures the way liquid density falls as temperature rises toward the critical point, where it meets the vapour density.
With the true critical compressibility factor, the Rackett equation is accurate to a few percent for non-polar liquids, but it does worse for polar and hydrogen-bonded liquids such as water and alcohols. A simple fix, due to Spencer and Danner, replaces \(Z_c\) with an adjustable parameter \(Z_{RA}\) fitted to one or more measured liquid densities. Fitted from a single density near room temperature, the modified equation then predicts densities over a wide temperature range to about 1 or 2 percent.
Worked problem
Hot ethanol in the reflux drum
A level transmitter on the rectifier reflux drum was calibrated with the density of ethanol at 20 °C, 789 kg/m³, but the drum operates at about 78 °C. For ethanol, \(T_c = 513.9\ \text{K}\), \(V_c = 167\ \text{cm}^3\text{/mol}\) and \(Z_c = 0.240\) (approximate). Estimate the liquid density at 78 °C with the Rackett equation, first with \(Z_c\) and then with \(Z_{RA}\) fitted to the 20 °C density.
Show solution
- With \(Z_c\): \(T_r = 351.15/513.9 = 0.6833\); exponent \((1 - 0.6833)^{2/7} = 0.7200\); \(V = 167 \times 0.240^{0.7200} = 59.8\ \text{cm}^3\text{/mol}\); density \(= 46.07/59.8 = 0.771\ \text{g/cm}^3\), about 5 percent above the measured value of roughly 736 kg/m³.
- Fit \(Z_{RA}\): at 20 °C, \(V = 46.07/0.789 = 58.39\ \text{cm}^3\text{/mol}\), and \((1 - 293.15/513.9)^{2/7} = 0.7855\), so \(Z_{RA} = (58.39/167)^{1/0.7855} = 0.2624\).
- At 78 °C: \(V = 167 \times 0.2624^{0.7200} = 63.7\ \text{cm}^3\text{/mol}\); density \(= 46.07/63.7 = 0.723\ \text{g/cm}^3\), within about 2 percent of the measured value.
Answer: Hot ethanol is about 7 percent less dense than at 20 °C. A differential-pressure level transmitter calibrated for 789 kg/m³ would read about 7 percent low in a drum of 78 °C liquid, enough to matter for reflux control. The fix is to calibrate for the operating density, or to compensate the reading for temperature.
# Generalized correlations: Rackett liquid densities and Pitzer virial estimates for gases
import math
R = 8.314
# Tc (K), Pc (bar), omega, Vc (cm3/mol), Zc, molar mass (g/mol); approximate literature values
data = {"carbon dioxide": (304.2, 73.8, 0.224, 94.0, 0.274, 44.01),
        "ammonia":        (405.7, 112.8, 0.253, 72.5, 0.242, 17.03),
        "ethanol":        (513.9, 61.5, 0.645, 167.0, 0.240, 46.07),
        "water":          (647.1, 220.6, 0.345, 55.9, 0.229, 18.02)}

def rackett(T, Tc, Vc, Zc):
    """Saturated liquid molar volume (cm3/mol)."""
    return Vc * Zc ** ((1 - T / Tc) ** (2 / 7))

checks = [("carbon dioxide", -20, 1032), ("ammonia", -10, 652), ("ethanol", 20, 789),
          ("ethanol", 78, 736), ("water", 25, 997), ("water", 150, 917)]
print("Rackett saturated liquid densities (measured values approximate)")
for name, t, meas in checks:
    Tc, Pc, w, Vc, Zc, M = data[name]
    V = rackett(t + 273.15, Tc, Vc, Zc)
    rho = M / V * 1000
    print(f"  {name:15s} {t:5.0f} C  {rho:7.1f} kg/m3  measured {meas:5.0f}  error {100*(rho-meas)/meas:+5.1f} %")

# One-point fit: back out an effective Rackett parameter Z_RA from one measured density, then extrapolate
Tc, Pc, w, Vc, Zc, M = data["ethanol"]
V20 = M / 789 * 1000                                   # cm3/mol at 20 C
ZRA = (V20 / Vc) ** (1 / (1 - 293.15 / Tc) ** (2 / 7))
for t, meas in ((50, 763), (78, 736)):
    rho = M / rackett(t + 273.15, Tc, Vc, ZRA) * 1000
    print(f"  ethanol with fitted Z_RA = {ZRA:.4f}: {t} C {rho:6.1f} kg/m3, measured about {meas}, error {100*(rho-meas)/meas:+.1f} %")

def z_pitzer(T, P, Tc, Pc, w):
    Tr, Pr = T / Tc, P / Pc
    B0 = 0.083 - 0.422 / Tr ** 1.6
    B1 = 0.139 - 0.172 / Tr ** 4.2
    return 1 + (B0 + w * B1) * Pr / Tr, Tr, Pr

print("Ammonia vapour in the refrigeration plant (Pitzer virial)")
for label, t, p in (("evaporator outlet", -10, 2.9), ("compressor discharge", 110, 13.5), ("condenser inlet", 35, 13.5)):
    Tc, Pc, w, Vc, Zc, M = data["ammonia"]
    z, Tr, Pr = z_pitzer(t + 273.15, p, Tc, Pc, w)
    rho = p * 1e5 * M / 1000 / (z * R * (t + 273.15))
    ok = "inside" if z > 0.85 else "outside"
print(f" {label:21s} Tr = {Tr:.3f} Pr = {Pr:.4f} Z = {z:.4f} density {rho:6.2f} kg/m3 ({ok} the virial range)")Rackett saturated liquid densities (measured values approximate) carbon dioxide -20 C 1018.7 kg/m3 measured 1032 error -1.3 % ammonia -10 C 672.8 kg/m3 measured 652 error +3.2 % ethanol 20 C 846.3 kg/m3 measured 789 error +7.3 % ethanol 78 C 770.8 kg/m3 measured 736 error +4.7 % water 25 C 1109.1 kg/m3 measured 997 error +11.2 % water 150 C 957.4 kg/m3 measured 917 error +4.4 % ethanol with fitted Z_RA = 0.2624: 50 C 755.8 kg/m3, measured about 763, error -0.9 % ethanol with fitted Z_RA = 0.2624: 78 C 722.8 kg/m3, measured about 736, error -1.8 % Ammonia vapour in the refrigeration plant (Pitzer virial) evaporator outlet Tr = 0.649 Pr = 0.0257 Z = 0.9606 density 2.35 kg/m3 (inside the virial range) compressor discharge Tr = 0.944 Pr = 0.1197 Z = 0.9494 density 7.60 kg/m3 (inside the virial range) condenser inlet Tr = 0.760 Pr = 0.1197 Z = 0.8936 density 10.04 kg/m3 (inside the virial range)
The program shows the pattern clearly. With the true \(Z_c\), Rackett is within about 1 percent for carbon dioxide but 7 percent off for ethanol and 11 percent off for water at room temperature. With one fitted parameter, ethanol comes within 1 to 2 percent over the whole range. For ammonia vapour, the Pitzer correlation stays inside its range at all three points in the refrigeration plant.
Compressed liquids
The Rackett equation gives saturated liquid volumes. For liquids at pressures above saturation, the correction is usually small, because liquids are nearly incompressible, and it can be estimated from the isothermal compressibility or from correlations such as the Tait equation. For liquid carbon dioxide at −20 °C, raising the pressure from its vapour pressure of 19.6 bar to 30 bar increases the density by roughly 1 percent, while for liquid water near room temperature the same pressure rise changes the density by less than 0.1 percent. Liquids close to their critical points are much more compressible, and there the correction can be significant.
When to use which method
Generalized correlations are tools for estimation, checking and screening. They are excellent when you need a quick, defensible number for a gas at moderate pressure or a liquid near saturation, and when no better data are available. For final designs, regulatory reporting and custody transfer, engineers turn to measured data or reference-quality equations of state where those exist: the IAPWS formulation for water, and the reference equations for carbon dioxide, ammonia, nitrogen and many refrigerants that sit behind modern property software. Knowing a corresponding-states estimate also protects you from errors in that software: if a simulator reports a carbon dioxide density at 20 bar and 35 °C that is 20 percent away from the virial estimate, something in the setup is wrong.
Common mistakes
MistakeApplying two-parameter corresponding states to molecules of very different shape.
InsteadInclude the acentric factor; Z = Z⁰ + ωZ¹.
MistakeUsing the Rackett equation with Zc for water or alcohols.
InsteadFit Z_RA to a measured density, or use measured data.
MistakeUsing the truncated virial equation near the critical point.
InsteadCheck that Z stays above about 0.85; otherwise use a cubic or the Lee-Kesler tables.
MistakeCalibrating a liquid level instrument at the wrong temperature.
InsteadUse the liquid density at operating temperature, or compensate for temperature.
MistakeAssuming compressed liquid volumes always equal saturated volumes.
InsteadThe correction is small far from the critical point but grows near it.
Summary and key terms
- Corresponding states: fluids at the same Tr and Pr behave alike; Pitzer adds ω: Z = Z⁰ + ωZ¹.
- Lee-Kesler tables give Z⁰ and Z¹ over wide ranges for gases and liquids.
- Generalized charts show Z near 1 at low Pr or high Tr and deep dips near the critical point.
- The Pitzer virial correlation is a convenient hand method while Z is above about 0.85.
- Rackett: V_sat = Vc Zc^((1 − Tr)^(2/7)); fit Z_RA for polar liquids.
- Compressed liquid corrections are small except near the critical point.
- Corresponding states
- The principle that fluids behave alike when compared at the same reduced conditions.
- Simple fluid
- A fluid with spherical molecules and acentric factor near zero, such as argon.
- Lee-Kesler correlation
- A three-parameter generalized correlation giving tables of Z⁰ and Z¹ and related departures.
- Rackett equation
- A corresponding-states correlation for saturated liquid molar volume.
- Rackett parameter
- Z_RA, an adjustable replacement for Zc in the Rackett equation, fitted to data.
- Tait equation
- An empirical equation for the volume of compressed liquids.
Practice problems
Work each problem on paper first, then reveal the answer to check.
What is the reduced temperature and pressure of nitrogen (Tc = 126.2 K, Pc = 34.0 bar) at 25 °C and 50 bar?
Show answer
Tr = 298.15/126.2 = 2.36; Pr = 50/34.0 = 1.47.
From the chart's behaviour, is nitrogen at those conditions close to ideal?
Show answer
Yes; at Tr above 2 the compressibility factor stays close to 1.
Using the program, what is Z for ammonia at the condenser inlet, 13.5 bar and 35 °C?
Show answer
About 0.894.
Estimate the Rackett density of carbon dioxide at −20 °C using Zc.
Show answer
About 1019 kg/m³, roughly 1 percent below the measured 1032 kg/m³.
Why does Rackett with Zc do poorly for water?
Show answer
Hydrogen bonding makes water's liquid structure unlike that of the simple fluids the correlation is built on.
How much does a 7 percent density error affect a differential-pressure level reading?
Show answer
The indicated level is in error by about 7 percent, since level is inferred as ΔP/(ρg).
Lesson quiz · 5 questions
Score 60% or more to complete this lesson.
Create a free account to save your progress, take quizzes and earn a certificate.