
CHE-220 · Lesson 2 of 12 · 23 min
PVT behaviour of pure fluids
Lakeshore Gas's liquefaction unit takes carbon dioxide from the fermenter scrubber at about 1 bar and 30 °C, compresses it in stages to about 20 bar, dries it, and condenses it to liquid at about −20 °C using ammonia refrigeration. The liquid goes to insulated storage tanks at about 17 bar and −25 °C, and from there to tanker trucks. Along this route, carbon dioxide passes through vapour, near-critical gas and liquid states, and a careless choice of conditions could even form solid dry ice inside equipment. Before any energy calculation, Ingrid wants Theo to be able to say, for any temperature and pressure on the route, which phase carbon dioxide is in and roughly how dense it is. That is the subject of this lesson: the pressure-volume-temperature, or PVT, behaviour of pure fluids.
The pressure-temperature diagram
The simplest map of a pure substance is its pressure-temperature diagram. Three lines divide it into solid, liquid and vapour regions. The sublimation curve separates solid from vapour, the fusion or melting curve separates solid from liquid, and the vaporization curve, or vapour pressure curve, separates liquid from vapour. The three lines meet at the triple point, the only temperature and pressure at which solid, liquid and vapour coexist. The vaporization curve ends at the critical point, above which liquid and vapour can no longer be told apart.
For carbon dioxide, the triple point is at about −56.6 °C and 5.18 bar, and the critical point at about 31.0 °C and 73.8 bar (approximate values). Because the triple point pressure is above atmospheric, liquid carbon dioxide cannot exist at 1 atm. At atmospheric pressure, solid carbon dioxide turns directly to vapour at −78.5 °C, which is why dry ice sublimes instead of melting. Water is the opposite: its triple point is at 0.01 °C and only 0.61 kPa, so liquid water is stable at ordinary pressures over a wide temperature range.
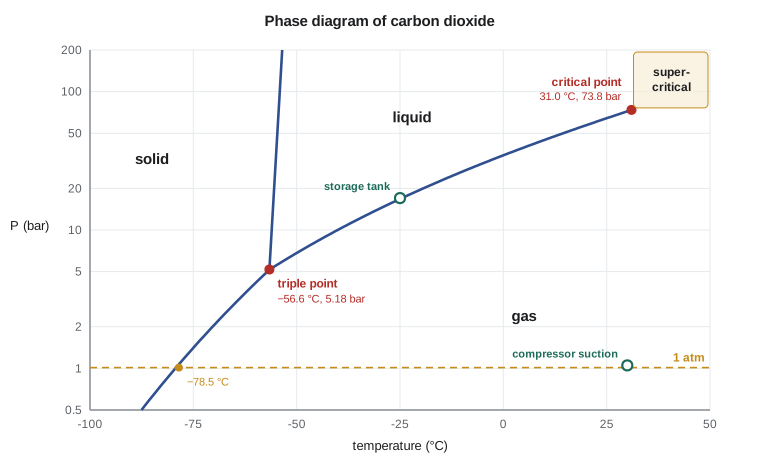
Crossing the vaporization curve at constant pressure produces a phase change at a definite temperature, the boiling point at that pressure. Crossing it by going around the critical point, through the region above both the critical temperature and the critical pressure, produces no phase change at all: the fluid's density changes smoothly from gas-like to liquid-like values. That supercritical region is where carbon dioxide pipelines for carbon capture operate, at pressures of 80 bar or more, and where supercritical carbon dioxide is used as an extraction solvent for decaffeinating coffee and extracting hop oils.
The pressure-volume diagram
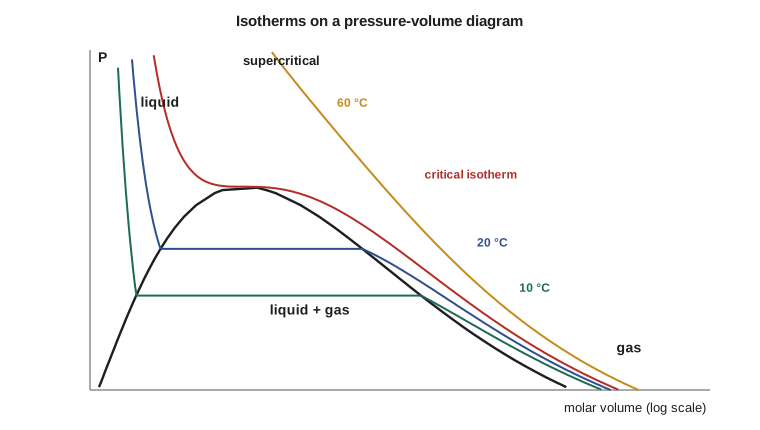
The pressure-temperature diagram hides what happens during a phase change, because the whole two-phase mixture sits at one point on the vaporization curve. The pressure-volume diagram spreads it out. Plot pressure against molar or specific volume, and the two-phase region appears as a dome. The left side of the dome is the saturated liquid curve, the right side the saturated vapour curve, and they meet at the critical point at the top of the dome.
Isotherms on this diagram tell the story. Above the critical temperature, an isotherm falls smoothly as volume increases, approaching the ideal gas hyperbola at large volumes. Below the critical temperature, an isotherm starting in the liquid region falls steeply, because liquids are nearly incompressible, until it meets the saturated liquid curve. Across the dome it is a horizontal line at the vapour pressure, as liquid turns to vapour at constant temperature and pressure. Beyond the saturated vapour curve it falls again, more gently, through the superheated vapour region. The critical isotherm has a horizontal inflection point at the critical point, where both its slope and its curvature are zero.
Those two conditions matter in Lesson 4: they are how the constants of cubic equations of state are fitted to the critical temperature and pressure of each fluid.
Saturated, subcooled and superheated states
Several words describe where a state sits relative to the vaporization curve. A saturated liquid is liquid at its boiling point for the given pressure, ready to start vaporizing; a saturated vapour is vapour at its dew point, ready to start condensing. A subcooled liquid is below its boiling point at the given pressure, which is the same as saying it is at a pressure above its vapour pressure at the given temperature; that is why it is also called a compressed liquid. A superheated vapour is above its dew point at the given pressure.
Inside the dome, the fluid is a two-phase mixture. Its overall state needs one more number than temperature or pressure alone: the quality \(x\), the mass or mole fraction of the mixture that is vapour. Any specific property of the mixture is then a weighted average of the saturated liquid and saturated vapour values at that temperature. That lever rule applies to volume, internal energy, enthalpy and entropy alike, and you used it with steam tables in CHE-200.
Worked problem
Liquid and vapour in a storage tank
A 60 m³ storage tank holds carbon dioxide at saturation at −25 °C, where the vapour pressure is about 16.8 bar. Approximate saturated densities are 1070 kg/m³ for the liquid and 44 kg/m³ for the vapour. The tank holds 45 t of carbon dioxide. Find the mass of liquid and vapour, the fraction of the tank volume occupied by liquid, and the overall quality.
Show solution
- Let \(m_l\) and \(m_v\) be the liquid and vapour masses. Mass: \(m_l + m_v = 45\,000\ \text{kg}\).
- Volume: \(m_l/1070 + m_v/44 = 60\ \text{m}^3\).
- Substitute \(m_v = 45\,000 - m_l\): \(m_l(1/1070 - 1/44) = 60 - 45\,000/44 = -962.7\), so \(m_l = 962.7/0.021793 = 44\,180\ \text{kg}\) and \(m_v = 820\ \text{kg}\).
- Liquid volume \(= 44\,180/1070 = 41.3\ \text{m}^3\), or 69 percent of the tank.
- Quality \(x = 820/45\,000 = 0.018\).
Answer: Although vapour fills almost a third of the tank, it is less than 2 percent of the mass, because the vapour is so much less dense than the liquid. Storage tanks are never filled completely with liquid: if a full tank warms, the liquid expands and the pressure can rise very quickly. Fill limits leave a vapour space for that reason.
Vapour pressure correlations
The vapour pressure curve is the most important single piece of PVT information for separation and refrigeration design. In CHE-200 you used the Antoine equation, which fits measured data well over a limited range with three constants for each substance. When data are scarce, a corresponding-states correlation can estimate the whole curve from the critical temperature, critical pressure and acentric factor alone. The Lee-Kesler correlation is a common choice. It expresses the reduced vapour pressure, the vapour pressure divided by the critical pressure, as a function of reduced temperature with a simple-fluid term and a correction proportional to the acentric factor.
The acentric factor is defined from the vapour pressure itself. Simple spherical molecules such as argon and krypton have a reduced vapour pressure of almost exactly 0.1 at a reduced temperature of 0.7. Other fluids fall below that value, and the acentric factor measures by how much: \(\omega = -1 - \log_{10}(P_r^{sat})_{T_r = 0.7}\). It is near zero for methane, about 0.22 for carbon dioxide, about 0.34 for water and about 0.64 for ethanol (approximate values). Corresponding-states methods work best for non-polar and slightly polar molecules; for strongly polar or hydrogen-bonding fluids such as water and alcohols, measured data or fluid-specific equations should be used where accuracy matters.
# Vapour pressures from the Lee-Kesler correlation and phase checks for carbon dioxide
import math

def psat_lk(T, Tc, Pc, w):
    """Lee-Kesler vapour pressure correlation (pressure in the same units as Pc)."""
    Tr = T / Tc
    f0 = 5.92714 - 6.09648 / Tr - 1.28862 * math.log(Tr) + 0.169347 * Tr ** 6
    f1 = 15.2518 - 15.6875 / Tr - 13.4721 * math.log(Tr) + 0.43577 * Tr ** 6
    return Pc * math.exp(f0 + w * f1)

# Critical constants (approximate): Tc in K, Pc in bar, acentric factor
fluids = {"carbon dioxide": (304.2, 73.8, 0.224), "ammonia": (405.7, 112.8, 0.253),
          "ethanol": (513.9, 61.5, 0.645), "water": (647.1, 220.6, 0.345)}
checks = {"carbon dioxide": (253.15, 19.7), "ammonia": (263.15, 2.91),
          "ethanol": (351.4, 1.013), "water": (373.15, 1.013)}   # T (K) and approximate measured Psat (bar)
print("fluid            T (C)   Psat Lee-Kesler   Psat measured (bar)")
for name, (T, meas) in checks.items():
    print(f"{name:15s} {T-273.15:6.1f} {psat_lk(T, *fluids[name]):13.3f} {meas:16.3f}")

# Where is carbon dioxide at each point on the liquefaction route?
Tc, Pc, w = fluids["carbon dioxide"]
Ttp, Ptp = 216.6, 5.18      # triple point (approximate)
def phase(T, P):
    if T >= Tc and P >= Pc: return "supercritical fluid"
    if T >= Tc: return "gas (above Tc)"
    if T < Ttp: return "solid or vapour (below triple point)"
    ps = psat_lk(T, Tc, Pc, w)
    if abs(P - ps) / ps < 0.01: return f"saturated (Psat = {ps:.1f} bar)"
    return f"compressed liquid (Psat = {ps:.1f} bar)" if P > ps else f"superheated vapour (Psat = {ps:.1f} bar)"

route = [("compressor suction", 30, 1.05), ("after intercooler", 35, 20.0), ("condenser outlet", -20, 20.0),
         ("storage tank", -25, 17.0), ("pipeline option", 40, 80.0), ("dry ice at 1 atm", -78.5, 1.013)]
for label, t, p in route:
print(f"{label:20s} {t:7.1f} C {p:6.2f} bar -> {phase(t + 273.15, p)}")fluid T (C) Psat Lee-Kesler Psat measured (bar) carbon dioxide -20.0 19.612 19.700 ammonia -10.0 2.851 2.910 ethanol 78.2 1.009 1.013 water 100.0 0.912 1.013 compressor suction 30.0 C 1.05 bar -> superheated vapour (Psat = 72.1 bar) after intercooler 35.0 C 20.00 bar -> gas (above Tc) condenser outlet -20.0 C 20.00 bar -> compressed liquid (Psat = 19.6 bar) storage tank -25.0 C 17.00 bar -> compressed liquid (Psat = 16.8 bar) pipeline option 40.0 C 80.00 bar -> supercritical fluid dry ice at 1 atm -78.5 C 1.01 bar -> solid or vapour (below triple point)
For carbon dioxide, ammonia and ethanol, the correlation lands within about 2 percent of the measured values at the check points. For water at 100 °C it is about 10 percent low, a reminder that corresponding-states methods struggle with strongly hydrogen-bonded fluids. The phase check confirms the route. At 20 bar and 35 °C the gas is above its critical temperature but well below the critical pressure, so it is a dense gas that cannot be condensed without cooling. At −20 °C and 20 bar it is liquid, just above its vapour pressure of about 19.6 bar. At 1 atm and −78.5 °C it is below the triple point, where only solid and vapour can exist.
Avoiding dry ice in the plant
The triple point has practical consequences. If liquid carbon dioxide at 17 bar is let down through a valve to a pressure below 5.18 bar, part of it flashes to vapour and the rest cools until it freezes into solid snow. Dry ice can plug valves, relief lines and instrument tubing. For that reason, liquid carbon dioxide systems are designed to keep the pressure above the triple point everywhere liquid could be present, and relief devices on liquid lines discharge to locations where any snow formed does no harm. Lakeshore Gas's tanker loading procedure, for example, pressurizes the truck tank with vapour before liquid transfer starts, so that liquid never meets a low-pressure space.
Similar reasoning applies to other fluids. Liquid ammonia let down to atmospheric pressure flashes and cools to about −33 °C, its normal boiling point, which is why ammonia releases produce cold, visible clouds of vapour and droplets. Water, with its triple point far below atmospheric pressure, never freezes when its pressure falls, only when its temperature does.
Single-phase regions and the shape of PVT data
Away from the dome, PVT behaviour falls into recognizable patterns. Liquids have small volumes that change little with pressure and modestly with temperature. Two coefficients describe them: the volume expansivity \(\beta\), the fractional change in volume per degree at constant pressure, and the isothermal compressibility \(\kappa\), the fractional decrease in volume per unit pressure rise at constant temperature. For water near room temperature, \(\beta\) is about \(2\times10^{-4}\ \text{K}^{-1}\) and \(\kappa\) about \(4.5\times10^{-5}\ \text{bar}^{-1}\) (approximate values). Those small numbers explain why a sealed, completely full pipe of liquid can burst when it warms: a few degrees of warming would need hundreds of bar to hold the volume constant.
For water, \(\beta/\kappa\) is about 4.4 bar per kelvin, so a blocked-in, liquid-full line that warms by 10 K could see its pressure rise by over 40 bar. That is the basis for thermal relief valves on any section of liquid-full piping that can be isolated between two closed valves, including the liquid carbon dioxide lines at Lakeshore Gas.
Gases, by contrast, have large volumes that change strongly with both pressure and temperature. At low pressure they approach ideal gas behaviour, discussed in Lesson 3. Near the dome and near the critical point, they depart from it strongly, which is where the equations of state of Lessons 3 to 5 earn their place.
Common mistakes
MistakeAssuming liquid carbon dioxide can exist at atmospheric pressure.
InsteadIts triple point is at 5.18 bar, so at 1 atm only solid and vapour exist.
MistakeCalling any fluid above its critical temperature a supercritical fluid.
InsteadSupercritical means above both the critical temperature and the critical pressure; above Tc but at low pressure it is simply a gas.
MistakeUsing the lever rule with densities instead of specific volumes.
InsteadSpecific volumes and other specific properties are mass-weighted; densities are not additive that way.
MistakeTrusting corresponding-states vapour pressures for water and alcohols.
InsteadUse measured data or fluid-specific correlations for strongly polar fluids.
MistakeIgnoring thermal expansion of trapped liquid.
InsteadA blocked-in liquid-full line can reach very high pressure when it warms; provide thermal relief.
Summary and key terms
- The P-T diagram shows sublimation, fusion and vaporization curves meeting at the triple point; vaporization ends at the critical point.
- On a P-V diagram, subcritical isotherms are horizontal across the dome; the critical isotherm has a horizontal inflection at the critical point.
- Subcooled or compressed liquid lies above its vapour pressure; superheated vapour lies below it.
- In the two-phase region, specific properties follow M = M^l + xΔM^lv.
- The Lee-Kesler correlation estimates vapour pressure from Tc, Pc and ω; ω is defined at Tr = 0.7.
- Liquids are described by expansivity and compressibility; trapped liquid needs thermal relief.
- Triple point
- The unique temperature and pressure at which solid, liquid and vapour of a pure substance coexist.
- Critical point
- The end of the vaporization curve, above which liquid and vapour cannot be distinguished.
- Quality
- The mass or mole fraction of a two-phase mixture that is vapour.
- Compressed liquid
- A liquid at a pressure above its vapour pressure at its temperature; also called subcooled liquid.
- Superheated vapour
- A vapour at a temperature above its dew point at its pressure.
- Acentric factor
- A parameter defined from the reduced vapour pressure at Tr = 0.7, measuring departure from simple-fluid behaviour.
- Supercritical fluid
- A fluid above both its critical temperature and its critical pressure.
Practice problems
Work each problem on paper first, then reveal the answer to check.
Is water at 150 °C and 10 bar liquid or vapour? Its vapour pressure at 150 °C is about 4.76 bar.
Show answer
The pressure is above the vapour pressure, so it is compressed liquid.
A tank at saturation contains 2 kg of vapour and 98 kg of liquid. What is the quality?
Show answer
x = 2/100 = 0.02.
Using the program's correlation, roughly what is the vapour pressure of carbon dioxide at −25 °C?
Show answer
About 16.8 bar.
Why does liquid carbon dioxide turn to snow when it is let down to atmospheric pressure?
Show answer
Atmospheric pressure is below the triple point, so the flashing liquid cools until the remainder freezes.
For water with β/κ ≈ 4.4 bar/K, estimate the pressure rise in a blocked-in liquid-full line that warms by 5 K.
Show answer
About 22 bar.
What is the reduced temperature of carbon dioxide at −20 °C?
Show answer
Tr = 253.15/304.2 = 0.832.
Lesson quiz · 5 questions
Score 60% or more to complete this lesson.
Create a free account to save your progress, take quizzes and earn a certificate.