
AWS-114 · Lesson 2 of 12 · 19 min
Bias and fairness in data and models
▶ Video coming soon A video version of this lesson is on the way.
The no-show model had looked good in the autumn assessment. On the test set it caught 62 of every 100 real no-shows (a recall of 0.62), and of the bookings it flagged, 41 in 100 really were no-shows (a precision of 0.41). Those were overall numbers. At the second governance session Noor put up a slide that split them by clinic group, and the room went quiet.
"The city clinics look fine," she said. "The rural clinics don't. The model misses about half of the real no-shows there." Andre, who ran the clinics, saw the problem at once. The extra reminder the model triggers is a small benefit, but it is a benefit, and the clients who needed it most were getting it least. Nothing about the model had been designed to treat rural clients differently. The difference had come from the data.
This lesson explains where bias comes from, how it shows up in data and in models, how bias and variance affect accuracy for different groups, and the practical ways to measure and reduce unfairness. These ideas are central to the exam's responsible AI domain.
What bias means in AI
In everyday speech, bias means prejudice. In machine learning the word has two related meanings, and the exam uses both. The first is unfair bias: a system producing systematically different, and unjustified, outcomes for different groups of people. The second is the statistical sense in the bias and variance trade-off, which describes how a model's errors arise. Both matter, and they are connected, because a model that underfits a small group is both statistically biased for that group and unfair to it.
Fairness is the goal: outcomes that do not disadvantage people unjustly because of who they are. There is no single mathematical definition of fairness that fits every case, and some definitions cannot all be satisfied at once. Choosing which fairness measure matters for a particular system is a judgment about its purpose and its harms, which is why it belongs to the governance group and not only to the data scientist.
Where bias comes from
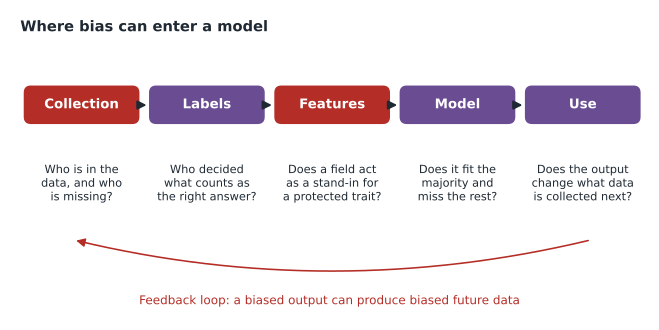
Noor walked through the stages in the diagram using the no-show model as the example.
Collection. Who is in the data, and who is missing? The training data came from three years of bookings. The rural clinics had joined the group at different times, and two of them had moved onto the shared booking system only eighteen months earlier, so they contributed far fewer examples. Their clients were underrepresented. A model learns most from what it sees most.
Labels. Who decided what counts as the right answer? A booking was labelled a no-show if it was marked that way in the system. But Andre explained that at two rural clinics, receptionists sometimes rebooked a missed appointment directly rather than marking it as missed, so some real no-shows were labelled as attended. That is label bias: the labels themselves were wrong more often for one group.
Features. Does a field act as a stand-in for a protected trait? The model used the client's postal code as a feature. Postal codes can correlate with income, ethnicity and age. Even when a model never sees a protected attribute directly, a proxy feature can carry it in. Noor checked and found that postal code added very little accuracy, so she proposed removing it.
Model. Does it fit the majority and miss the rest? A model optimized for overall accuracy will, if nothing stops it, fit the large group well and the small group poorly, because the small group contributes little to the overall score.
Use. Does the output change what data is collected next? This is the feedback loop. If the model's flags led staff to call some clients more often, those clients would generate more reminder data, and the model would keep learning most about them.
Characteristics of a good dataset
The exam guide lists characteristics of datasets that reduce the risk of bias. They are worth knowing as a set.
| Characteristic | What it means | What Noor changed |
|---|---|---|
| Inclusive | Covers the full range of people and situations the system will meet | Added the most recent year from the newer rural clinics |
| Diverse | Includes variety within each group, not just one typical case | Included winter and summer bookings, emergency and routine |
| Curated sources | Data comes from known, trusted, documented sources | Used only the booking system and the practice system, both documented |
| Balanced | Groups and outcomes are represented in reasonable proportions, or imbalance is corrected | Gave rural examples more weight in training |
| Accurately labelled | Labels reflect what really happened | Fixed the rebooking practice and relabelled what could be verified |
Bias, variance and groups
The statistical terms describe two ways a model can be wrong. Bias in this sense is error from a model that is too simple to capture the real pattern: it underfits, doing poorly on training data and new data alike. Variance is error from a model that is too sensitive to the training data: it overfits, memorizing noise so that it does well on training data and poorly on new data.
Both have effects on demographic groups. A small group gives the model few examples. A simple model may underfit that group, treating it as if it behaved like the majority. A complex model may overfit it, latching onto a few unusual examples. Either way, accuracy for the small group is worse and less stable than for the large one, even when the overall numbers look fine. That is exactly what happened with the rural clinics.
The usual remedies are familiar: more and better data for the underrepresented group, sensible model complexity, regularization to limit overfitting, and above all, evaluating results separately for each group so the problem is visible at all.
Measuring fairness
Noor showed Jonah how to compare groups with a few simple measures. Each one answers a different fairness question.
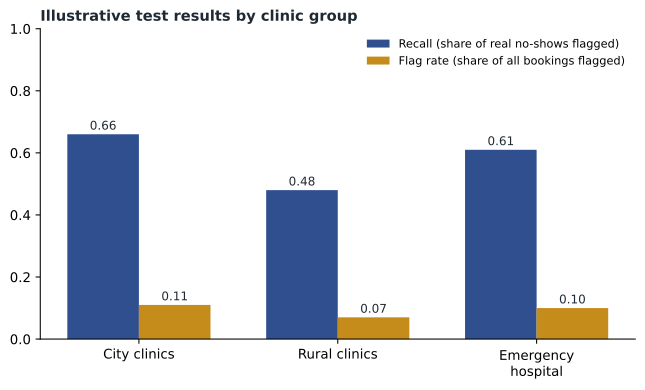
- Demographic parity compares the rate of positive outputs across groups. Here, the share of bookings flagged for an extra reminder: 0.11 for city clinics and 0.07 for rural ones.
- Equal opportunity compares the true positive rate, or recall, across groups: of the people who really will miss, what share does the model catch? Here 0.66 against 0.48.
- Predictive parity compares precision across groups: when the model flags someone, how often is it right?
- Disparate impact is the ratio of positive rates between groups, often compared with a threshold such as four-fifths. It comes from employment law in the United States and is widely used as a rough screen, not a legal verdict.
# Fairness measures for the no-show model on a test set (illustrative counts).
groups = {
    # flagged = bookings the model flagged; tp = flagged and really missed;
    # missed = all real no-shows; total = all bookings in the test set
    "city":  {"total": 30000, "flagged": 3300, "tp": 1386, "missed": 2100},
    "rural": {"total": 9000,  "flagged": 630,  "tp": 336,  "missed": 700},
}
for name, g in groups.items():
    flag_rate = g["flagged"] / g["total"]
    recall = g["tp"] / g["missed"]
    precision = g["tp"] / g["flagged"]
    print(f"{name:6} flag rate {flag_rate:.3f}  recall {recall:.2f}  precision {precision:.2f}")
ratio = (630 / 9000) / (3300 / 30000)
print(f"disparate impact ratio (rural / city): {ratio:.2f}")
print("gap in recall:", round(1386 / 2100 - 336 / 700, 2))city flag rate 0.110 recall 0.66 precision 0.42 rural flag rate 0.070 recall 0.48 precision 0.53 disparate impact ratio (rural / city): 0.64 gap in recall: 0.18
What this code does
It compares how the no-show model treats city and rural bookings. For each group it works out how often bookings get flagged, what share of real no-shows are caught, and what share of flags were right. It then compares the two flag rates and the two catch rates, showing rural clients are flagged less and their no-shows are caught less often.
The precision was similar in both groups, so when the model did flag a rural booking it was about as often right. The problem was recall: it missed more rural no-shows. The disparate impact ratio of about 0.64 fell well below the four-fifths screen. Noor was careful about what that meant. "For an extra reminder text, the harm of missing someone is small," she said. "But the gap tells us the model is worse for rural clients, and if we ever used it for something more important, the gap would matter a lot more."
Which measure matters depends on the use. For a benefit, such as an extra reminder or a waitlist offer, equal opportunity is usually the most relevant: everyone who needs the benefit should have a similar chance of getting it. For a burden, such as extra scrutiny, the false positive rate across groups matters more, because being wrongly flagged is the harm.
Detecting and monitoring bias
The exam guide names several practical ways to detect and monitor bias, trustworthiness and truthfulness. They are not only automated tools.
- Subgroup analysis. Split every evaluation by the groups that matter, as Noor did by clinic group, and also by species of patient, visit type and season.
- Analyzing label quality. Sample labels and check them against reality. Noor asked two rural receptionists to review 200 bookings each; they found the rebooking problem in an afternoon.
- Human audits. People who understand the domain review a sample of outputs, especially the uncertain or surprising ones.
- Automated measurement. Tools such as Amazon SageMaker Clarify compute bias measures before and after training and keep computing them in production. Lesson 4 covers Clarify.
For generative AI, bias shows up differently. A summarizer might describe the same symptoms more urgently for one breed than another, or a text generator might use different tones for different names. Testing involves running matched prompts that differ only in one attribute and comparing the outputs, as well as human review of samples.
Reducing unfairness
Noor's plan for the no-show model, written as a plan for the February pilot, had five parts. It added the newer rural booking data and fixed the labels that could be checked. It removed postal code as a feature. It weighted rural examples more heavily during training. It set the decision threshold so that rural recall would be checked separately before launch. And it added the recall gap to the monthly monitoring report, with a rule: if the gap exceeds 0.08, the governance group reviews the model.
"We won't make it perfectly equal," she told Andre. "What we can do is make the gap small, keep measuring it, and make sure someone is responsible for noticing when it grows."
Fairness is a decision, not just a number
Jonah asked the obvious question: why not simply force every measure to be equal? Noor explained that in most real problems this is impossible. If two groups have different underlying no-show rates, a model cannot generally have equal flag rates, equal recall and equal precision for both at the same time. Pushing one measure toward equality usually moves another apart. Something has to be chosen.
That choice is why fairness belongs to the governance group. The data scientist can show the trade-offs clearly: a table of each measure for each group at several thresholds. The business owner, the privacy lead and the people affected decide which trade-off is acceptable for this use, and the decision is written down in the model's documentation with the reasons. When someone later asks why the model behaves as it does, the answer is on record rather than in one person's memory.
Noor also reminded the group that fairness is not only about protected attributes in law. For Cascade Ridge, clinic location, client language and whether a client books online or by phone all affected who the model served well. A responsible review looks at any grouping where a gap would be unfair, not only the ones a statute names.
Common mistakes
MistakeJudging a model only by its overall accuracy.
InsteadBreak results down by the groups that matter; overall numbers can hide a poor result for a smaller group.
MistakeAssuming a model is fair because it never sees a protected attribute.
InsteadProxy features such as postal code can carry protected attributes indirectly. Check what each feature correlates with.
MistakeTreating labels as ground truth without checking them.
InsteadLabels can be wrong more often for some groups. Sample and verify them.
MistakeChoosing one fairness measure for every system.
InsteadPick measures that match the use: equal opportunity for benefits, false positive rates for burdens.
Worked problem
Which measure fits?
Cascade Ridge considers a second model that flags clients whose accounts might go unpaid, so staff ask for a deposit before surgery. Asking for a deposit is a burden. Which fairness measure should the governance group watch most closely, and why?
Show solution
- Being wrongly flagged means paying a deposit you did not need to pay, so the harm is a false positive.
- The group should compare false positive rates across client groups, such as clinic area or age band.
- Demographic parity is useful as a first screen, but it does not distinguish correct flags from wrong ones.
- Because the use is a burden with financial impact, the governance group might also classify it as a higher risk tier.
Answer: The false positive rate across groups matters most, because the harm falls on people wrongly flagged. The use is also riskier than the reminder model and deserves a higher review tier.
Summary and key terms
- In AI, unfair bias means unjustified differences in outcomes between groups; bias and variance describe underfitting and overfitting.
- Bias can enter through who is in the data, how labels were made, proxy features, the model's fit and feedback from its own use.
- Good datasets are inclusive, diverse, from curated sources, balanced and accurately labelled.
- Small groups are often hurt by both underfitting and overfitting.
- Fairness measures include demographic parity, equal opportunity, predictive parity and disparate impact; which one matters depends on whether the output is a benefit or a burden.
- Detection uses subgroup analysis, label checks, human audits and automated tools.
- Unfair bias
- Systematic, unjustified differences in outcomes for different groups.
- Proxy feature
- A feature that indirectly carries a protected attribute, such as postal code.
- Underfitting
- A model too simple to capture the pattern; high bias.
- Overfitting
- A model that memorizes training noise; high variance.
- Equal opportunity
- Similar true positive rates (recall) across groups.
- Demographic parity
- Similar rates of positive outputs across groups.
Practice problems
Work each problem on paper first, then reveal the answer to check.
Why can a model be unfair even if it never sees a protected attribute?
Show answer
Proxy features can carry the attribute indirectly.
What does subgroup analysis mean?
Show answer
Evaluating the model separately for each group that matters instead of only overall.
Overfitting is associated with high bias or high variance?
Show answer
High variance.
Lesson quiz · 5 questions
Score 60% or more to complete this lesson.
Create a free account to save your progress, take quizzes and earn a certificate.