
ARCH-340 · Lesson 6 of 12 · 19 min
Transit-oriented development
The guest this week is Amir Sadeghi, a transit planner who worked on Winnipeg's new bus network, launched on 29 June 2025, which reorganized the city's routes around a Primary Transit Network of frequent lines. He begins by drawing two maps on the whiteboard. On the first, a bus route wanders through a suburb, turning every few blocks to pass near as many houses as possible; it comes every forty minutes. On the second, a straight route runs along an avenue; it comes every ten minutes, and people walk a little farther to reach it. 'Which one would you use?' he asks. The students choose the second. 'So would most people,' he says. 'Frequency is freedom. If you have to plan your day around the schedule, you will drive when you can. If the bus comes every ten minutes, you just go. But frequent service is expensive, and it only makes sense where enough people live and work within a walk of the line. That is where you come in.'
What transit-oriented development is
Transit-oriented development, or TOD, is the planning of compact, walkable, mixed-use districts around transit stations so that many daily trips can be made on foot or by transit. The term was popularized by the architect Peter Calthorpe in The Next American Metropolis (1993), though the idea is older: streetcar suburbs of the late nineteenth and early twentieth centuries grew along lines that developers built to sell land, with shops at the stops and houses within a short walk. Many of the most walkable neighbourhoods in North American cities, including Winnipeg's Osborne Village and Corydon Avenue, began as streetcar districts.
Researchers Robert Cervero and Kara Kockelman summarized the built-environment factors that affect travel as the three Ds in 1997: density, diversity (a mix of uses) and design (walkable streets). Later work added destination accessibility (how many places can be reached), distance to transit and demand management (mainly parking supply and price). Studies generally find that each factor has a modest effect alone, but together they make a large difference in how often people drive.
The station area
The basic unit of TOD is the station area: the land within a comfortable walk of a stop. Planners commonly use 400 m, about five minutes, for local bus stops and 800 m, about ten minutes, for rapid transit and rail stations, though people will walk farther to faster, more frequent service. Within the station area, the most intense uses go closest to the stop.
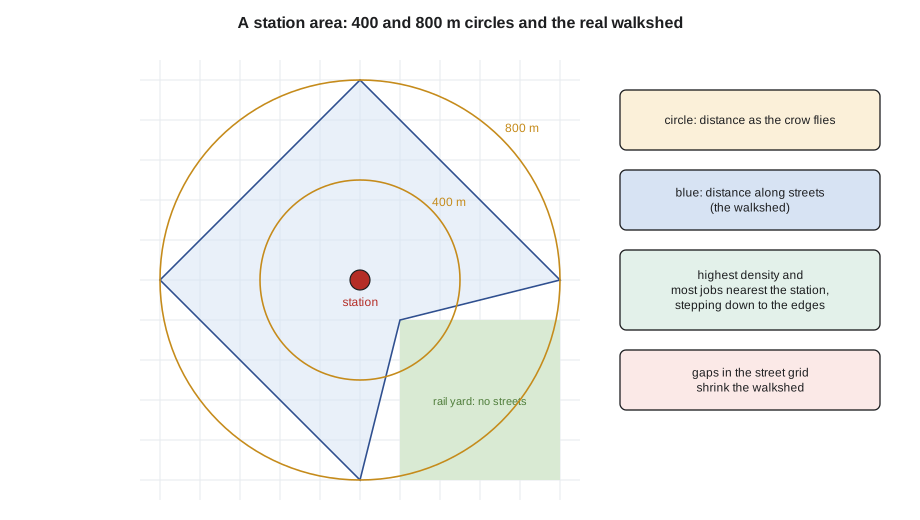
A circle drawn on a map overstates the real catchment, because people walk along streets, not through blocks. The ratio of the network walkshed to the circle is called the pedestrian catchment area ratio. On a fine, complete grid it is about 0.6 to 0.7, the diamond shape of the walkshed, while on a network with large blocks, barriers and dead ends it can fall below 0.3. Barriers such as rail yards, highways, rivers and large parking lots cut out whole sectors. In the greenway district the closed rail yard to the south-east of the corner removes nearly a quarter of the potential walkshed.
How many people near a station?
Transit agencies decide where to run frequent service largely on how many people can reach it. The students estimate the residents and jobs within the walkshed of the hub corner today and under their framework plan.
# Transit-oriented development: people and jobs near a station
import math
r_walk = 800                  # walking radius, m
pcar = 0.6                 # pedestrian catchment area ratio: network walkshed / circle
circle = math.pi * r_walk ** 2 / 10000
walkshed = circle * pcar
print(f"circle {circle:,.0f} ha, network walkshed {walkshed:,.0f} ha (ratio {pcar})")
scenarios = {  # homes per ha and jobs per ha on the developable share of the walkshed
    "today": (12, 6),
    "framework plan": (45, 20),
}
developable = 0.55            # share of the walkshed that is blocks, not streets, parks or rail
for name, (h, j) in scenarios.items():
    homes = walkshed * developable * h
    people = homes * 2.2
    jobs = walkshed * developable * j
    print(f"{name:<15} {homes:>6,.0f} homes, {people:>6,.0f} residents, {jobs:>6,.0f} jobs, "
f"{(people + jobs) / walkshed:>4.0f} residents plus jobs per ha")circle 201 ha, network walkshed 121 ha (ratio 0.6) today 796 homes, 1,752 residents, 398 jobs, 18 residents plus jobs per ha framework plan 2,986 homes, 6,569 residents, 1,327 jobs, 65 residents plus jobs per ha
Today the station area has fewer than 20 residents plus jobs per hectare, well below the level at which frequent service usually pays its way. The framework plan nearly quadruples that. Sadeghi tells them that their target is in line with what planners commonly cite for frequent bus service, and that the avenue's other stops would need similar growth for the whole line to justify ten-minute service in the long run. 'Transit and land use are a chicken and egg,' he says. 'The city will run frequent service first, on the promise that you will build. If you do not build, the service gets cut.'
Principles of TOD design
Calthorpe and others summarized TOD design in a set of principles that remain widely used.
- Intensity near the station: the highest densities and the most jobs and shops within the first 200 to 400 m, stepping down to the edges of the station area, as the gradient in Lesson 5 proposed.
- Mixed uses: homes, workplaces, shops, services and civic uses together, so that trips can be chained on foot and the station is busy at all hours.
- Walkable and connected streets: short blocks, direct routes to the station, safe crossings, wide sidewalks, trees, lighting and weather protection. Every extra minute of walking loses riders.
- A good arrival: a clear, sheltered, well-lit stop with seating, real-time information and a public space where people can wait, meet and buy a coffee.
- Limited parking: large surface parking lots near stations waste the most valuable land and break up walking routes. Parking can be reduced, shared, placed underground or behind buildings, and priced.
- Cycling connections: bicycle routes and secure parking extend the catchment of a station several times.
- Housing for many incomes: people with lower incomes are the most likely to use transit, so a share of the homes near stations should be affordable to them.
The last principle reflects experience. In many cities, new transit lines have raised land values and rents near stations and pushed out the people most likely to ride. Equitable transit-oriented development (eTOD) is the effort to plan station areas so that existing residents benefit and stay. Lesson 11 returns to it.
Types of station areas
Not every station should look the same. Planners distinguish station areas by their role in the city.
| Type | Typical role | Typical form |
|---|---|---|
| Downtown station | Regional jobs, culture, shopping | Towers, offices, large public spaces |
| Urban centre | District main street and civic hub | Mid-rise mixed use, plaza, library or hub |
| Neighbourhood station | Local shops and services | Three- to six-storey mixed use, infill housing |
| Campus or employment station | University, hospital or business park | Large institutional buildings, need for better walking links |
| Park-and-ride | Suburban commuters | Large parking lots, often redeveloped over time |
The hub corner is a neighbourhood station on its way to becoming a small urban centre: it has a civic building, a main street and two large sites that could hold many new homes. The students decide that its character should be a busy, local place with a plaza, shops and a mix of incomes, not a regional destination.
Local examples
Winnipeg's Southwest Transitway, a bus rapid transit corridor completed in two stages and fully open since 2020, connects downtown with the University of Manitoba. Station areas along it, such as the former rail lands near Pembina Highway, show both the promise of TOD and how slowly land around stations changes. The Primary Transit Network of 2025 extended frequent service along many avenues like the one in the greenway district. Naawi-Oodena, the Treaty One Nations' urban development on the 109-acre former Kapyong Barracks site, plans close to 5,000 homes along with shops, services and community spaces, which will make it one of the largest new walkable districts in the city.
Sadeghi's lesson from these examples is that transit does not create development by itself. Land use rules, public investment in streets and spaces, landowners willing to build and a market for new homes all have to line up. Where they do not, a station can sit in a field of parking for decades.
Parking
Parking is the single biggest land use in many North American districts. A surface parking stall with its share of aisle takes about 30 m², more than a small apartment. Minimum parking requirements in zoning, which require new buildings to provide a certain number of stalls, raise the cost of housing, make small infill projects impossible and encourage driving. Since the 2010s many cities have removed parking minimums near transit or citywide; Edmonton removed parking minimums citywide in 2020, Toronto removed most of its requirements in 2021, and other Canadian cities have studied similar changes. The students propose that the greenway district have no parking minimums, that existing surface lots near the corner be redeveloped, and that a small shared parking structure behind the avenue buildings serve the shops.
Designing the arrival at the hub corner
The students turn the principles into a design for the stop itself. A rider's experience begins well before the bus arrives: on the walk to the stop, at the crossing, in the shelter and in the few seconds of getting on. Joon-ho traces the four main approaches to the corner and finds that two of them cross the avenue at points with no signal, where people dash between cars. The framework adds a signalized crossing with a raised table at the corner and a refuge island in the middle of the avenue. Wren extends the curb at both stops into bus bulbs, so buses stop in the travel lane rather than pulling in and out of traffic, which saves time on every trip and frees sidewalk space for shelters. Ingrid places the eastbound stop on the far side of the intersection, so the bus clears the signal before it stops, and lines up the westbound stop with the hub's plaza.
Callum's contribution is less visible. He notices that the avenue's sidewalks are plowed by the city but the plaza is cleared by the hub's caretaker, and that on the morning of the class walk the two had been cleared at different times, leaving a ridge of packed snow at the edge of the stop. Sadeghi laughs. 'That ridge is the most important detail in your scheme,' he says. 'A wheelchair user or a parent with a stroller cannot get over it, and nobody owns it.' The framework assigns maintenance of the stop and plaza to one body, with heated paving at the boarding area as an option to test. Real-time arrival signs, a warm waiting room inside the hub's commons with a view of the stop, bicycle parking under cover and a bike share station complete the arrival.
Exercise 6: station area plan
- Choose a frequent transit stop in your city. Draw the 400 m and 800 m circles and the network walkshed.
- Calculate the pedestrian catchment area ratio and identify the barriers that reduce it.
- Estimate residents and jobs in the walkshed using census data or by counting buildings.
- Propose three new connections that would enlarge the walkshed.
- Draw a density gradient and a parking strategy for the station area.
Measuring success
Sadeghi asks the students how they would know, ten years from now, whether the station area had worked. They list measures that the city could track each year: the number of riders boarding at the hub corner; the share of trips by residents made on foot, by bicycle or by transit; the number of homes and jobs within the walkshed; the share of new homes that are affordable; the number of surface parking stalls removed; and the number of people injured in collisions on the avenue. Sadeghi adds two that planners often forget. The first is the time it takes a typical resident to reach a grocery store, a clinic and a school without a car. The second is the share of existing residents who are still in the district. A station area that gains riders but loses its long-time residents, he says, has succeeded for the transit agency and failed for the neighbourhood.
Common mistakes
MistakeDrawing a circle and treating it as the catchment.
InsteadMap the network walkshed and the barriers that cut it.
MistakeSurrounding a station with parking.
InsteadPut homes, jobs and public space nearest the station; reduce, share or relocate parking.
MistakeAssuming transit alone will bring development.
InsteadAlign land use rules, public investment, landowners and the market.
MistakeForgetting the people who already live there.
InsteadPlan for affordable homes and protections so current residents benefit.
MistakeDesigning a bare stop on a wide road.
InsteadMake the arrival sheltered, lit, informative and connected to a public space.
Summary and key terms
- TOD plans compact, mixed-use, walkable districts around transit so many trips can be made without a car.
- Density, diversity, design, destinations, distance to transit and parking all affect travel.
- Station areas are usually defined by 400 and 800 walks, but the network walkshed is smaller than the circle.
- Frequent service needs enough residents and jobs nearby; land use and transit must grow together.
- Parking near stations wastes valuable land; many cities have removed minimum requirements.
- Equitable TOD aims to let existing residents benefit from new transit and stay.
- Transit-oriented development
- Compact, walkable, mixed-use development planned around transit stations.
- Station area
- The land within a comfortable walk of a transit stop.
- Pedestrian catchment area ratio
- The network walkshed divided by the area of a circle of the same radius.
- Bus rapid transit
- Bus service with stations, frequent trips and features such as dedicated lanes and all-door boarding.
- Parking minimum
- A zoning rule requiring new buildings to provide a minimum number of parking stalls.
- Equitable TOD
- Transit-oriented development planned so existing residents, especially those with lower incomes, benefit and stay.
Practice problems
Work each problem on paper first, then reveal the answer to check.
A station's network walkshed is 85 ha within an 800 m circle of 201 ha. What is the pedestrian catchment area ratio?
Show answer
About 0.42, suggesting barriers or a poorly connected network.
Name the three Ds of Cervero and Kockelman.
Show answer
Density, diversity and design.
Why do frequent routes on straight avenues often attract more riders than winding routes that pass more homes?
Show answer
Frequency and directness save more time than a slightly shorter walk; people will walk farther for a bus that comes often and goes straight.
Give two ways to reduce the land taken by parking near a station.
Show answer
Remove parking minimums; share parking between uses; put it behind or under buildings; price it.
Why should TOD include homes for lower incomes?
Show answer
People with lower incomes are most likely to ride transit and most at risk of being priced out by new investment.
Lesson quiz · 5 questions
Score 60% or more to complete this lesson.
Create a free account to save your progress, take quizzes and earn a certificate.