
ARCH-250 · Lesson 10 of 12 · 21 min
Environmental simulation tools
In the tenth week the studio becomes a computer lab. Abernathy has invited a young energy modeller, Priyanka Sethi, who works for the engineering firm advising the city on the community hub, and who brings her laptop and a warning. She opens two models of the same school, prepared by two consultants for the same competition two years earlier. One predicted that the school would use about 95 kWh per m² a year; the other about 160. The building was finished last year, and its first year of utility bills came to about 180. 'Both models were made with respected software,' she says. 'Both were wrong, one of them badly. The software did exactly what it was told. The difference was in what people told it: how many hours the building would be open, how many computers there would be, how well the envelope would be built and how the systems would actually be run. Simulation is the most powerful design tool you will learn this year, and the easiest one to fool yourself with.'
Why simulate
Rules of thumb and hand calculations, like those in the previous lessons, are fast and teach the physics. But real buildings are complicated: heat, light and air interact hour by hour; the weather changes constantly; people come and go; and equipment responds to controls. Simulation tools model these interactions over a full year, hour by hour or even minute by minute, using representative weather data. They let designers compare options early, before the building is fixed; size systems; demonstrate compliance with codes by the performance path; predict comfort, daylight and acoustics; and test how a design will behave in a future climate.
Simulation is most valuable early, when the big decisions are still open: orientation, massing, window area and placement, shading, envelope performance and the choice between natural and mechanical ventilation. A rough model of simple boxes, tested in many variations, can tell a team far more at that stage than a detailed model built after the design is finished, when it can only confirm or condemn what has already been decided. Abernathy calls this 'simulation as a sketch'.
Kinds of tools
- Whole-building energy simulation calculates heating, cooling, lighting, fan and equipment energy over a year. EnergyPlus, developed for the United States Department of Energy and released in 2001, is the most widely used engine; OpenStudio, DesignBuilder, IES VE and other programs provide interfaces to it or have engines of their own. In Canada, programs based on the same methods are used to show compliance with the energy code, and HOT2000, from Natural Resources Canada, is the standard tool for modelling houses.
- Daylight simulation calculates illuminance, daylight factors, climate-based metrics and glare. Radiance, a ray-tracing program begun at the Lawrence Berkeley National Laboratory in the 1980s, is the engine behind most daylight tools, including plug-ins that run inside the modelling and parametric software architects already use.
- Computational fluid dynamics, CFD, solves the equations of air movement in a room, an atrium or around a building, showing airflow, temperatures and wind at street level. It is powerful but demanding, and its results depend heavily on the boundary conditions set by the user.
- Room acoustic software traces sound rays or particles through a three-dimensional model to predict reverberation, clarity and speech intelligibility, and can produce audio simulations that let a client listen to a hall before it is built.
- Detailed envelope tools calculate two-dimensional heat flow through junctions to find thermal bridge values, and hygrothermal tools, such as WUFI from Germany's Fraunhofer Institute for Building Physics, model the movement of heat and moisture through assemblies over years to predict condensation and drying.
Many of these tools can now be linked through parametric environments, so that a single model of the building's geometry feeds energy, daylight and comfort simulations at once, and a designer can change the massing and see the results within minutes. Some practices are beginning to train fast surrogate models on thousands of simulations to give near-instant feedback while sketching.
Weather data
Every simulation is driven by weather. Typical meteorological year files, assembled from real months chosen to represent the long-term average, are the standard input; in Canada the corresponding files are the Canadian Weather Year for Energy Calculation, or CWEC, files, published for hundreds of locations, and in the United States the TMY files. They are distributed in a common format, EPW, that most programs read. Because typical years are averages, they omit the extremes: a model run on a typical year will not show the worst cold snap or the hottest week. Designers therefore also test buildings with extreme-year files for overheating and resilience, and increasingly with future weather files, generated from climate models for the 2050s or 2080s, to see how comfort and energy use will change over the building's life.
The workflow
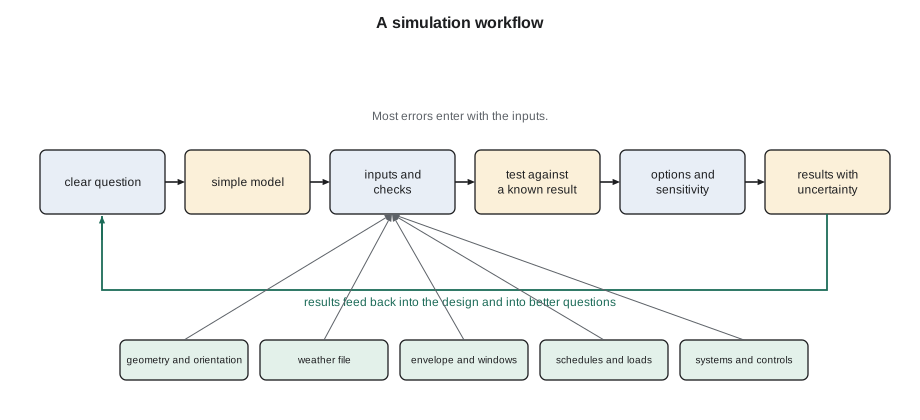
Sethi teaches a workflow that applies to every kind of simulation.
- Ask a clear question. 'How much energy will the hub use?' is too broad; 'How does the energy use of the hall change if its windows are increased from 20 to 40 of every 100 units of wall area?' can be answered.
- Build the simplest model that can answer it, with the right geometry, orientation, envelope, zones, schedules and loads.
- Check the inputs. Most errors are in the inputs: wrong orientation, units, weather file, schedules or occupancy. Have someone else check them.
- Test the model against something known: a hand calculation, a similar building's measured energy use, or published benchmarks.
- Run the options and a sensitivity analysis: vary the uncertain inputs to see which ones change the answer most.
- Interpret and communicate the results with their uncertainty, in terms the team and client understand.
A simple model you can check
To understand what simulation software does, the students build a monthly energy balance for the hub themselves. For each month, the model estimates the heat lost through the envelope and by ventilation, subtracts the useful solar and internal gains, and reports the heating needed. It is far cruder than an hourly simulation, but every line can be checked by hand, and it reproduces the main trends.
# Monthly heating balance of the community hub, with a sensitivity test on window area
temps = [-16.4, -13.2, -5.8, 4.4, 11.6, 17.0, 19.7, 18.8, 12.7, 5.0, -4.9, -13.2]                          # monthly mean outdoor temperatures (C)
hours = [744, 672, 744, 720, 744, 720, 744, 744, 720, 744, 720, 744]
sun_south = [75, 95, 110, 90, 70, 60, 65, 80, 95, 95, 65, 60]                         # solar heat on south glass per month (kWh per m2)
inside = 20
floor = 2458                           # floor area (m2)
wall_area, roof_area = 1900, 1500     # opaque envelope before windows (m2)
u_wall, u_roof, u_win = 0.18, 0.11, 0.9
ua_air = 600                           # ventilation after heat recovery, plus leakage (per degree)
internal = 25000                         # people, lights and equipment, average (W)

def heating(window_share, u_wall=u_wall):
    glass = wall_area * window_share
    ua = (wall_area - glass) * u_wall + roof_area * u_roof + glass * u_win + ua_air
    total = 0.0
    for t, h, s in zip(temps, hours, sun_south):
        loss = ua * max(0, inside - t) * h * 0.001
        gains = (0.4 * glass * 0.45 * s + internal * h * 0.001)    # about 40 of every 100 window units face south
        useful = min(gains, loss) * 0.9                            # not all gains are useful
        total += max(0.0, loss - useful)
    return total / floor

base = heating(0.25)
print(f"Heating demand with windows on 25 of every 100 units of wall: {base:.0f} kWh per m2 per year")
for share in (0.15, 0.35, 0.50):
    print(f"   windows on {int(share * 100)} of every 100 units: {heating(share):.0f} kWh per m2")
print(f"Walls twice as well insulated, windows at 25: {heating(0.25, u_wall / 2):.0f} kWh per m2")Heating demand with windows on 25 of every 100 units of wall: 22 kWh per m2 per year windows on 15 of every 100 units: 21 kWh per m2 windows on 35 of every 100 units: 24 kWh per m2 windows on 50 of every 100 units: 26 kWh per m2 Walls twice as well insulated, windows at 25: 17 kWh per m2
In this model, the hub's heating demand changes surprisingly little as the window area grows from 15 to 35 of every 100 units of wall: the extra losses through the glass are partly offset by solar gains, because some of the windows face south. Beyond that, losses dominate and demand rises. Doubling the wall insulation saves about a fifth of the heating, less than many students expect, because ventilation, windows and the roof together lose more heat than the walls do, as the hand calculation in Lesson 5 suggested. The model leaves out cooling, daylight and comfort, which would change the picture for large windows: an hourly simulation would show the overheating and glare risks that a monthly balance cannot. That is the point of the exercise: a simple model tells you what to look for in a complex one.
Uncertainty and the performance gap
Buildings often use more energy than their models predicted, sometimes much more. Studies in several countries have found that measured energy use can exceed design predictions by large margins, a difference known as the performance gap. Its causes are well known: occupancy and operating hours longer than assumed, more plug loads from computers and appliances, envelopes built less airtight or with more thermal bridges than drawn, systems installed or controlled differently from the design, and models that assume ideal operation. The design model is a prediction of the building as designed and operated as assumed, not a forecast of the building as built and used.
Good practice narrows the gap. Use realistic schedules and loads from similar buildings rather than default values; include thermal bridges and realistic airtightness; test the sensitivity of the results to the uncertain inputs and report a range rather than a single number; commission the systems carefully; test the airtightness of the finished building; and compare the first years of metered energy use with the model, adjusting operation to close the difference. Models used to show code compliance follow strict rules so that designs can be compared fairly, and their results are not meant to predict the actual bills.
Comfort, daylight and acoustics in the same model
Energy is only one output. An hourly model also predicts indoor temperatures, so it can show how many hours a room will be too warm, an essential check for passively cooled and naturally ventilated buildings. Daylight models show which parts of a room meet the targets of Lesson 6 and where glare will occur. Acoustic models show reverberation and speech intelligibility. Running these together matters, because many design decisions trade one against another: larger windows help daylight and passive heating but raise heat loss, overheating and glare; exposed concrete helps night cooling but makes rooms reverberant; operable windows help ventilation but let in traffic noise.
Sethi ends with advice she gives every new modeller. 'Never show a client a result you cannot explain in a sentence. If the model says something surprising, assume first that the model is wrong, and find out why. Half the time it is. The other half, you have learned something about the building.'
Worked problem
Choosing the hall's windows with simulation
Callum wants the hall to have a long south window wall facing the greenway. The engineer worries about heat loss and summer overheating. How should the team use simulation to decide?
Show solution
- Ask two clear questions: how do annual heating and cooling energy change with the window area, and how many hours a year does the hall exceed its comfort limit?
- Build a simple model of the hall with its real orientation, envelope, ventilation and a realistic schedule of events.
- Run window shares of 15, 25, 35 and 50 of every 100 units of the south wall, each with and without the exterior shading designed in Lesson 2.
- Run the same cases with a future weather file for the 2050s.
- Compare the results with the daylight model, which shows that above about 35 the hall gains little useful daylight but much more glare.
Answer: The team chooses windows on about 35 of every 100 units of the south wall with exterior shading, a balance that heats well in winter, stays comfortable in summer now and in the future climate, and gives the hall good daylight without glare.
Exercise 10: a sketch simulation
This exercise takes about one week.
- Pose two clear questions about the environmental performance of your hub design.
- Build a simple energy and daylight model of the relevant part of the building in the software provided.
- Check the model against a hand calculation from Lessons 5 and 6 and explain any difference.
- Run at least four design options and a sensitivity test on the two most uncertain inputs.
- Present the results on one sheet, with their uncertainty and the design decision they support.
Common mistakes
MistakeBuilding a detailed model only after the design is fixed.
InsteadSimulate early with simple models, when decisions are still open.
MistakeTrusting default schedules and loads.
InsteadUse realistic values from similar buildings and test their sensitivity.
MistakeReporting a single number as a prediction of the bills.
InsteadReport ranges and explain the assumptions.
MistakeUsing only a typical weather year.
InsteadTest extremes and future climates too.
MistakeAccepting surprising results without checking.
InsteadCheck inputs and compare with hand calculations first.
Summary and key terms
- Simulation models energy, comfort, daylight, airflow and acoustics over time with representative weather.
- It is most valuable early in design, used as a sketch to compare options.
- Typical weather files omit extremes; extreme and future weather files test resilience.
- Most errors are in the inputs; a clear question, simple model, checks and sensitivity analysis keep results honest.
- Measured energy use often exceeds predictions; realistic inputs, commissioning and feedback narrow the performance gap.
- Energy simulation
- Calculation of a building's energy use and indoor conditions over time.
- Weather file
- A year of hourly weather data used to drive a simulation.
- Sensitivity analysis
- Varying uncertain inputs to see which ones most affect the results.
- Performance gap
- The difference between predicted and measured energy use.
- CFD
- Computational fluid dynamics, the numerical simulation of air and fluid flow.
- Commissioning
- Testing and adjusting building systems to make sure they work as designed.
Practice problems
Work each problem on paper first, then reveal the answer to check.
Why is simulation most useful early in design?
Show answer
The largest decisions are still open, and simple models can compare many options quickly.
What do typical meteorological year files leave out?
Show answer
Extreme weather, such as the coldest snaps and hottest weeks.
Name three causes of the performance gap.
Show answer
Longer occupancy than assumed, more plug loads, and envelopes or systems built or run differently from the design.
What is a sensitivity analysis?
Show answer
Varying uncertain inputs to see which change the results most.
A model predicts a surprising result. What should you do first?
Show answer
Assume the model may be wrong and check the inputs and a hand calculation.
Lesson quiz · 5 questions
Score 60% or more to complete this lesson.
Create a free account to save your progress, take quizzes and earn a certificate.