
ACCT-421 · Lesson 11 of 12 · 28 min
Enterprise risk management and planning under uncertainty
Every decision in this course has involved risk: the chance that demand, prices, costs or the performance of a new product turn out differently from plan. Lesson 6 dealt with risk in a single decision. This lesson takes an organization-wide view. Enterprise risk management (ERM) is the set of practices an organization uses to identify, assess and respond to risks across all its activities in a way that supports its strategy. The lesson covers the main ERM frameworks, risk appetite and key risk indicators, responses including hedging, and then two planning tools that put uncertainty at the centre of budgeting: Monte Carlo simulation of the budget and driver-based rolling forecasts. ACCT-321 discussed the behavioural effects of budgets; here the focus is on representing uncertainty honestly in plans.
Frameworks for ERM
Two frameworks dominate practice. The Committee of Sponsoring Organizations of the Treadway Commission (COSO) published Enterprise Risk Management: Integrating with Strategy and Performance in 2017, replacing its 2004 framework. It organizes ERM into five components: governance and culture; strategy and objective-setting; performance, which covers identifying, assessing, prioritizing and responding to risks; review and revision; and information, communication and reporting. These are supported by twenty principles. Its central message is that risk management should be integrated with strategy setting and performance management rather than run as a separate compliance exercise. The International Organization for Standardization's ISO 31000:2018 provides shorter, more general guidelines built around principles, a framework and a process of risk identification, analysis, evaluation and treatment, with communication, monitoring and review throughout.
| Feature | COSO ERM (2017) | ISO 31000 (2018) |
|---|---|---|
| Form | Framework with five components and twenty principles | International guidelines: principles, framework, process |
| Emphasis | Integration with strategy and performance | A generic process applicable to any organization |
| Common users | Large companies, especially those familiar with COSO internal control | Organizations worldwide, including the public sector |
| Certification | None | Guidelines only; not certifiable |
| Key concept | Risk appetite linked to strategy | Risk as the effect of uncertainty on objectives |
Both frameworks define risk broadly, as the effect of uncertainty on objectives, which includes upside as well as downside. That framing matters for performance management: the same uncertainty in steel prices that threatens Northgate's margins could, if prices fall, create an opportunity to win share from importers. ERM is not only about avoiding losses but about taking the right risks in pursuit of objectives.
Risk appetite, tolerance and capacity
Risk appetite is the amount and type of risk an organization is willing to accept in pursuit of its objectives. It is set by the board and should be expressed in terms that can guide decisions. Risk capacity is the maximum risk the organization can bear without threatening its survival, for example before breaching debt covenants or running out of cash. Risk tolerance, in COSO's 2017 usage, is the acceptable range of variation in performance around a target. A useful appetite statement is specific: rather than saying the company has a moderate appetite for financial risk, it says, for example, that the company will not accept a greater than 10 per cent chance of breaching its lending covenants in any year.
Northgate's board has adopted an appetite statement with several elements. It is willing to take substantial product and market risk to grow service revenue and connected products. It has a low appetite for safety and quality risk. It will not accept more than a 10 per cent probability that operating profit falls below 6 million dollars in any year, the level at which its bank covenant on interest coverage would be at risk. And it will hedge at least half of its forecast net US dollar receipts for the coming twelve months.
Identifying and assessing risks
Risk identification draws on many sources: strategy documents, process maps, incident histories, interviews and workshops, industry studies and the external environment. The results are usually recorded in a risk register that describes each risk, its causes and consequences, its owner, the existing controls and the planned responses. Risks are then assessed for likelihood and impact, often on simple scales, and plotted on a heat map so that attention goes to those that are both likely and severe.
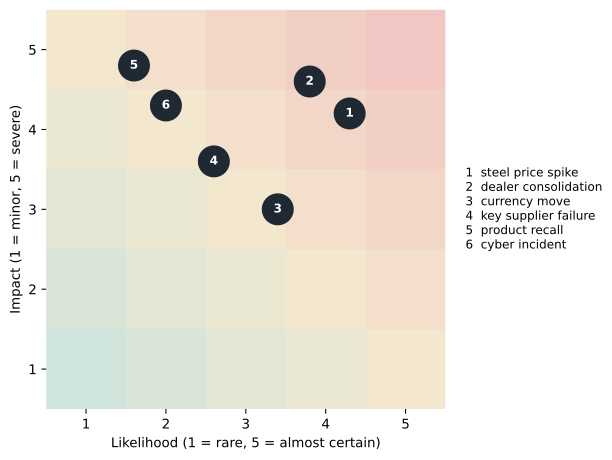
Heat maps are useful for communication but have well-known weaknesses. The scales are subjective, and different people interpret likely or severe differently. Multiplying ordinal scores, such as likelihood 4 times impact 3, produces numbers that look precise but have no clear meaning. And plotting each risk separately ignores correlations: Northgate's steel price risk and its volume risk are linked, because strong farm incomes raise both equipment demand and steel demand. For the few risks that matter most to the financial plan, quantitative modelling is better.
Key risk indicators
Key risk indicators (KRIs) are measures that give early warning of increasing risk, in the same way that leading indicators in lesson 2 give early warning of performance. Good KRIs are linked to specific risks, have thresholds that trigger action and are reported to the people responsible for the response. Northgate tracks several.
| Risk | Key risk indicator | Threshold | Response when triggered |
|---|---|---|---|
| Steel price spike | Hot-rolled coil price index, month-on-month change | Rise of more than 8% in a month | Review price list; extend supplier contracts |
| Dealer financial stress | Dealer receivables over 60 days | More than 6% of receivables | Tighten credit; review floor-plan financing |
| Farm income downturn | Grain futures prices and farm income forecasts | Forecast farm income down 15% | Cut production plan; defer discretionary capital |
| Quality failure | Field failure rate in first 90 days | Above 1.5% of units shipped | Engineering review; containment at the plant |
| Key supplier failure | Supplier on-time delivery and credit rating | Below 90% or credit downgrade | Qualify alternate supplier; build safety stock |
Responding to risk
Risk responses are usually grouped into four kinds. Avoidance means not undertaking the activity, such as declining to enter a market. Reduction means lowering likelihood or impact, through controls, diversification or design changes. Sharing or transfer means passing part of the risk to others, through insurance, hedging, contracts or outsourcing. Acceptance means retaining the risk, usually because it is within appetite or because the cost of other responses exceeds the benefit. COSO adds pursuit, accepting more risk to achieve better performance, which reflects its view that risk is part of strategy.
Hedging is a common response to financial risks such as currency, commodity prices and interest rates. A forward contract fixes the exchange rate at which Northgate will convert future foreign currency receipts, removing uncertainty about their value in its home currency but also giving up any gain if the rate moves favourably. Options provide protection against adverse moves while keeping some upside, at the cost of a premium. For steel, Northgate cannot easily hedge with exchange-traded contracts for the exact products it buys, so it uses fixed-price supply contracts for part of its needs and price-adjustment clauses in its dealer price list. ACCT-212 and FIN-301 cover hedge accounting and derivatives; the management accounting question is how much to hedge, which depends on the risk appetite and on how the hedged exposure affects the plan.
Natural hedges can be as effective as financial ones. A company with revenues and costs in the same foreign currency is partly protected from exchange rate movements. Northgate's purchases of motors and bearings from US suppliers offset part of its US dollar sales; increasing such purchases would increase the natural hedge.
Simulating the budget
A conventional budget is a single set of numbers, a point estimate. It says nothing about how likely those numbers are or how far actual results might fall from them. Monte Carlo simulation replaces single estimates for uncertain inputs with probability distributions, runs the budget model thousands of times with randomly drawn inputs, and produces a distribution of outcomes. The finance team can then answer questions that a point budget cannot: what is the probability of missing the budget, and what is the probability of breaching the covenant?
# Monte Carlo simulation of Northgate's 2027 operating profit (invented data, millions of dollars).
import numpy as np
rng = np.random.default_rng(2027)
n = 20000
budget_profit = 12.4
volume = rng.normal(1.00, 0.06, n)                 # volume index relative to plan
price = rng.normal(1.00, 0.015, n)                 # price realization
steel = rng.lognormal(0.0, 0.10, n)                # steel price index (25% of revenue at plan)
fx = rng.normal(0.0, 0.05, n)                      # change in the export currency's value
# steel prices tend to rise when farm demand is strong: correlate steel with volume
steel = steel * (1 + 0.35 * (volume - 1))
revenue = 152.0 * volume * price * (1 + 0.30 * fx)  # 30% of sales are in a foreign currency
steel_cost = 38.0 * volume * steel
other_var = 47.6 * volume
fixed = 54.0 + rng.normal(0, 0.8, n)
profit = revenue - steel_cost - other_var - fixed
p5, p50, p95 = np.percentile(profit, [5, 50, 95])
print(f"Plan operating profit: {152.0 - 38.0 - 47.6 - 54.0:.1f}  (budget {budget_profit})")
print(f"Simulated mean {profit.mean():.2f}; P5 {p5:.2f}  P50 {p50:.2f}  P95 {p95:.2f}")
print(f"P(profit below budget)          {np.mean(profit < budget_profit):.1%}")
print(f"P(profit below 6.0, covenant)   {np.mean(profit < 6.0):.1%}")
for name, x in [('volume', volume), ('price', price), ('steel', steel), ('currency', fx)]:
print(f" correlation of profit with {name:8s} {np.corrcoef(x, profit)[0, 1]:+.2f}")Plan operating profit: 12.4 (budget 12.4) Simulated mean 12.20; P5 2.55 P50 12.17 P95 22.25 P(profit below budget) 51.6% P(profit below 6.0, covenant) 14.9% correlation of profit with volume +0.53 correlation of profit with price +0.38 correlation of profit with steel -0.51 correlation of profit with currency +0.38
The plan shows operating profit of 12.4 million, but the simulation shows a wide distribution around it. The median is 12.2 million and the mean slightly lower, because steel price increases are more damaging than decreases are helpful and because steel prices rise with volume. There is about a 52 per cent chance of missing the budget, which is what one should expect of a median plan, and a 90 per cent range from about 2.6 to 22.3 million. Most importantly for the board, there is about a 15 per cent chance that operating profit falls below 6 million, above the 10 per cent appetite limit.
The correlations show which inputs drive the spread: volume and steel prices, followed by price realization and the exchange rate. That points to responses. Hedging more of the foreign currency exposure would narrow the distribution; so would fixed-price steel contracts. The team re-runs the simulation with three-quarters of the currency exposure hedged and half of steel purchases at fixed prices, and the probability of falling below 6 million drops to about 9 per cent, within the appetite limit. The simulation turns the risk appetite statement from an aspiration into a test that the plan can pass or fail.
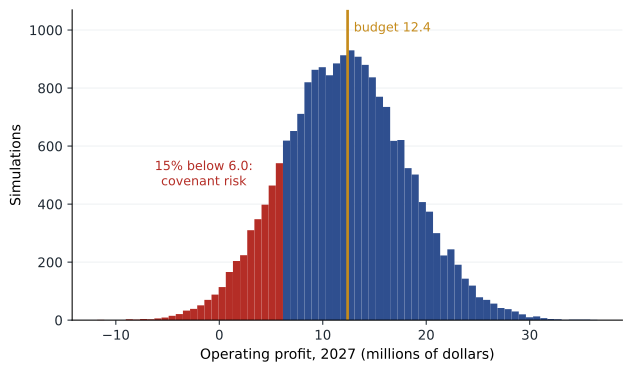
Simulation has its own risks. The output is only as good as the distributions and correlations chosen, and those are judgments. A model that assumes normal distributions may understate the chance of extreme events. And a precise-looking probability can create false confidence. Good practice documents the assumptions, tests the results against alternative assumptions and presents probabilities rounded to a level that reflects their reliability.
Driver-based rolling forecasts
Lesson 2 noted that the beyond budgeting movement recommends separating forecasts from targets and replacing annual budgets with rolling forecasts. A rolling forecast always looks the same distance ahead, such as five quarters: each quarter, one quarter drops off and a new one is added. Driver-based forecasts build revenue and costs from a few operational drivers, such as order intake, conversion rates and prices, rather than from line-by-line extrapolation. Together, they produce forecasts that are quicker to update and easier to explain.
# Driver-based rolling forecast: revenue from dealer orders and backlog (invented data, millions).
# Each quarter, the forecast is extended so that it always looks five quarters ahead.
season = {1: 0.80, 2: 1.35, 3: 1.05, 4: 0.80}        # farm equipment orders peak in spring
conv_now, conv_next = 0.55, 0.45                     # share of orders shipped this quarter / next
quarters = ['2026Q4', '2027Q1', '2027Q2', '2027Q3', '2027Q4', '2028Q1']
base_orders = 37.5                                    # deseasonalized quarterly order intake
growth = 0.008                                        # per quarter
backlog_in = 16.2                                     # orders carried in from 2026Q3

def forecast(start_backlog, base, g, qs):
    carried, rows = start_backlog, []
    for i, q in enumerate(qs):
        orders = base * (1 + g) ** i * season[int(q[-1])]
        revenue = carried + orders * conv_now
        carried = orders * conv_next
        rows.append((q, orders, revenue))
    return rows

print('Forecast made at the end of 2026Q3:')
first = forecast(backlog_in, base_orders, growth, quarters[:5])
for q, o, r in first:
    print(f"  {q}: orders {o:6.1f}  revenue {r:6.1f}")
print(f"Revenue for calendar 2027 expected: {sum(r for q, o, r in first if q.startswith('2027')):.1f}")
# a quarter later: actual 2026Q4 orders came in 6% below forecast; management lowers the base
# and the forecast rolls forward one quarter
actual_q4_orders = base_orders * season[4] * 0.94
new_backlog = actual_q4_orders * conv_next
print('Forecast rolled forward at the end of 2026Q4 (base orders cut 4%):')
rows = forecast(new_backlog, base_orders * 0.96 * (1 + growth), growth, quarters[1:])
for q, o, r in rows:
    print(f"  {q}: orders {o:6.1f}  revenue {r:6.1f}")
print(f"Revenue for calendar 2027 now expected: {sum(r for q, o, r in rows if q.startswith('2027')):.1f}")Forecast made at the end of 2026Q3: 2026Q4: orders 30.0 revenue 32.7 2027Q1: orders 30.2 revenue 30.1 2027Q2: orders 51.4 revenue 41.9 2027Q3: orders 40.3 revenue 45.3 2027Q4: orders 31.0 revenue 35.2 Revenue for calendar 2027 expected: 152.5 Forecast rolled forward at the end of 2026Q4 (base orders cut 4%): 2027Q1: orders 29.0 revenue 28.7 2027Q2: orders 49.4 revenue 40.2 2027Q3: orders 38.7 revenue 43.5 2027Q4: orders 29.7 revenue 33.8 2028Q1: orders 30.0 revenue 29.9 Revenue for calendar 2027 now expected: 146.2
At the end of the third quarter of 2026, the forecast for calendar 2027 revenue is 152.5 million, consistent with the budget of 152 million. Revenue in each quarter is built from orders received, with a seasonal pattern that peaks in spring, and from the share of orders shipped in the same quarter and the next. A quarter later, fourth-quarter orders come in 6 per cent below forecast, and dealers report caution because of lower grain prices. Management cuts the order base by 4 per cent and rolls the forecast forward to cover the first quarter of 2028. Expected 2027 revenue falls to 146.2 million, giving the executive team early warning of a shortfall of about 6 million against budget, and time to respond with production cuts, cost actions or a pricing review.
Note that the budget target does not change. The rolling forecast is the team's best estimate; the budget remains the commitment against which performance is evaluated. Keeping them separate removes the incentive to manipulate the forecast. Northgate's management also uses the forecast to decide whether to adjust discretionary spending and whether to activate the contingency plans prepared for a downturn.
Technology and the future of planning
Planning technology has changed quickly. Cloud-based planning platforms link operational and financial data, allowing driver-based models to be updated continuously. Machine learning forecasting tools can detect patterns in large data sets, and generative AI assistants can draft commentary, explain variances and answer questions about plans in natural language. Surveys of finance functions in 2025 and 2026 report rapid adoption of such tools, though most organizations describe themselves as early in their use. The same cautions apply as in ACCT-341: models must be validated, their outputs reviewed by people who understand the business, confidential data protected, and the accountability for forecasts kept with management. A machine learning forecast that no one can explain is hard to act on, and a confident AI-generated variance explanation can be wrong.
Common mistakes
MistakeTreating ERM as a compliance exercise separate from strategy.
InsteadIntegrate risk assessment with strategy setting, planning and performance management.
MistakeWriting a vague risk appetite statement.
InsteadState appetite in measurable terms that can be tested, such as a maximum probability of breaching a covenant.
MistakeRelying on heat maps for the most important financial risks.
InsteadQuantify key risks and their correlations with modelling or simulation.
MistakePresenting a single-number budget as if it were certain.
InsteadShow the range of outcomes and the probability of key thresholds.
MistakeLetting forecasts double as targets.
InsteadSeparate the best-estimate forecast from the performance target.
MistakeAccepting machine-generated forecasts without review.
InsteadValidate models and keep human accountability for forecasts and explanations.
Summary and key terms
- ERM identifies, assesses and responds to risks across the organization in support of strategy.
- COSO's 2017 framework stresses integration with strategy and performance; ISO 31000 provides general guidelines.
- Risk appetite should be specific and testable; Northgate limits the chance of profit below 6 million to 10%.
- Heat maps aid communication, but key financial risks need quantification and attention to correlation.
- Key risk indicators give early warning and trigger planned responses.
- Responses include avoidance, reduction, sharing or transfer, and acceptance; hedging and natural hedges reduce financial risk.
- Monte Carlo simulation shows a 15% chance of profit below 6 million, above appetite, until more hedging is added.
- Driver-based rolling forecasts gave early warning that 2027 revenue may fall about 6 million short of budget.
- Enterprise risk management (ERM)
- An organization-wide approach to identifying, assessing and responding to risks in support of strategy.
- Risk appetite
- The amount and type of risk an organization is willing to accept in pursuit of its objectives.
- Risk capacity
- The maximum risk an organization can bear without threatening its survival.
- Risk register
- A record of identified risks, their owners, assessments, controls and responses.
- Heat map
- A grid that plots risks by likelihood and impact.
- Key risk indicator (KRI)
- A measure that gives early warning of a change in risk.
- Natural hedge
- An offsetting exposure arising from normal operations, such as costs in the same currency as revenue.
- Monte Carlo simulation
- A method that runs a model many times with randomly drawn inputs to produce a distribution of outcomes.
- Rolling forecast
- A forecast that is regularly extended so that it always covers the same period ahead.
Practice problems
Work each problem on paper first, then reveal the answer to check.
What are the five components of COSO's 2017 ERM framework?
Show answer
Governance and culture; strategy and objective-setting; performance; review and revision; information, communication and reporting.
How does risk appetite differ from risk capacity?
Show answer
Appetite is what the organization is willing to accept; capacity is the most it can bear.
Why can multiplying likelihood and impact scores mislead?
Show answer
The scales are ordinal and subjective, so the products look precise but lack clear meaning.
Give an example of a KRI and its threshold at Northgate.
Show answer
Dealer receivables over 60 days above 6% of receivables, among others.
What is the simulated probability that operating profit falls below 6 million?
Show answer
About 15%.
Why is the simulated mean slightly below the plan?
Show answer
Steel price increases hurt more than decreases help, and steel prices rise with volume.
Change the steel volatility in the program from 0.10 to 0.05. What happens to the covenant risk?
Show answer
It falls, because the distribution of profit narrows.
What is a natural hedge, and how could Northgate increase one?
Show answer
An offsetting exposure from operations; by buying more inputs in the foreign currency it sells in.
After the fourth quarter, what is the forecast for 2027 revenue?
Show answer
About 146.2 million.
Why should the rolling forecast not replace the budget target?
Show answer
Keeping them separate removes the incentive to manipulate the forecast.
Lesson quiz · 5 questions
Score 60% or more to complete this lesson.
Create a free account to save your progress, take quizzes and earn a certificate.