
SLS-140 · Lesson 9 of 12 · 23 min
Reports and dashboards in a CRM
▶ Video coming soon A video version of this lesson is on the way.
Every Monday at 8:30, Darnell Brooks opens the same dashboard before his team meeting. It shows six tiles: new opportunities created last week, the open pipeline by stage, deals expected to close this month, deals past their stage limit, meetings booked by the inside team, and closed-won deals so far this quarter. In September he asked Grace to add a seventh tile: open tasks more than a week overdue, by owner. It changed the tone of the meeting. "Nobody wanted their name on that tile," he said, "and nobody needed me to say anything about it."
Reports and dashboards turn the records in a CRM into information people can act on. This lesson explains how CRM reports work, how to build and read a simple report, what makes a good dashboard, and the common ways reports mislead. It is an introduction for sellers who need to use and build everyday reports. The deeper numbers that sales leaders use, such as conversion rates by stage, sales velocity, forecast methods and territory analysis, are the subject of SLS-214 Sales Analytics and Forecasting.
Reports, list views and dashboards
CRMs offer three related ways to look at data. A list view is a filtered list of records of one type, such as "My open opportunities" or "Contacts with no email", which users can sort and edit directly. A report is a more structured query: it selects records that meet criteria, chooses which fields to show, groups and summarizes them (counts, totals, averages) and can display a chart. A dashboard is a page of charts and numbers, each fed by a report, designed to be read at a glance.
| List view | Report | Dashboard | |
|---|---|---|---|
| What it shows | Records of one type that meet a filter | Records that meet criteria, grouped and summarized | Several summaries on one page |
| Best for | Working through records and editing them | Answering a specific question | Monitoring regularly |
| Example | My opportunities closing this month | Open pipeline by stage and owner | Darnell's Monday dashboard |
| Who uses it most | Sellers | Sellers, managers, sales operations | Managers and leaders |
How a report is built
Most CRM report builders follow the same steps, whatever the vendor. First, choose the report type: which records the report is about, such as opportunities, or opportunities with their products, or accounts with their contacts. Second, set filters: which records to include, such as open opportunities owned by Maya with a close date this quarter. Third, choose columns: which fields to show. Fourth, group and summarize: for example, group by stage and total the amount. Fifth, add a chart if it helps. Finally, save the report in a shared or private folder and, if useful, schedule it to be emailed regularly.
Worked problem
Building a report: Maya's pipeline by stage
Maya wants a report of her open opportunities closing by December 31, 2026, grouped by stage with the total amount and number of deals in each. How should she build it?
Show solution
- Report type: opportunities.
- Filters: owner equals Maya Chen; stage is not Closed Won or Closed Lost; close date on or before December 31, 2026.
- Columns: opportunity name, account, amount, close date, next step, days in stage.
- Group by: stage, in pipeline order.
- Summaries: count of records and sum of amount for each group, and a grand total.
- Chart: a horizontal bar chart of amount by stage.
- Save: in Maya's private folder, scheduled to email her every Monday at 7:00.
Answer: A report that answers one question clearly, refreshes itself every week and lists the next step for every deal, so it is useful for action as well as for counting.
Filters do most of the work in a report, and most report errors come from them. A filter on "close date this quarter" excludes deals with no close date. A filter on owner excludes deals that were reassigned. A filter on a picklist value excludes records where someone typed a different spelling before the field was locked. When a report shows a surprising number, the first thing to check is the filters.
Reading a report
A report answers a question, so the first step in reading one is to know what question it answers. "Open pipeline by stage" answers "How much is in each stage right now?" It does not answer "How much will we close?" (that needs conversion rates and judgment, covered in SLS-214) or "Is the team working hard?" (that needs activity reports and context). Reading a report well also means checking the date range, the filters and how the totals are calculated, and asking what is missing.
Worked problem
Reading the team pipeline report
Ridgeline's team report for open opportunities on November 2, 2026 shows: Qualify, 14 deals, 186,000 dollars; Discover, 11 deals, 248,500 dollars; Propose, 9 deals, 212,400 dollars; Negotiate, 5 deals, 131,100 dollars. What is the total open pipeline, the average deal size, and the share of value in Propose and Negotiate?
Show solution
- Total value.
- \[186000 + 248500 + 212400 + 131100 = 778000\]
- Total deals.
- \[14 + 11 + 9 + 5 = 39\]
- Average deal size.
- \[778000 \div 39 \approx 19949\]
- Value in Propose and Negotiate.
- \[212400 + 131100 = 343500\]
- Share of the total.
- \[343500 \div 778000 \approx 0.44\]
Answer: The open pipeline is 778,000 dollars in 39 deals, an average of about 19,950 dollars each, with about 44 in 100 dollars of value in the two late stages. The report does not say how much will close; that needs the history and judgment covered in SLS-214.
Dashboards
A dashboard collects several report summaries on one page. A good dashboard is designed for a specific audience and a specific routine: a seller's daily view, a manager's weekly team meeting, a leader's monthly review. It shows a small number of measures that the audience can act on, arranged so the most important are seen first.
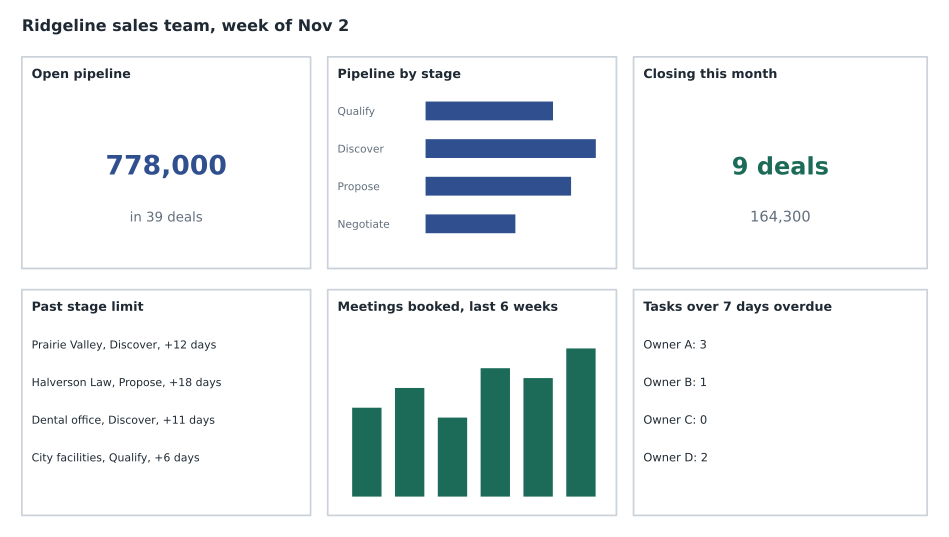
Measures on a dashboard fall into two broad kinds. Lagging indicators report results that have already happened, such as revenue closed last quarter. Leading indicators measure activities and conditions that tend to come before results, such as new opportunities created, meetings booked or proposals delivered. Leading indicators are more useful for managing a week, because something can still be done about them; lagging indicators confirm whether the work paid off. Darnell's Monday dashboard has mostly leading indicators for that reason.
| Do | Avoid |
|---|---|
| Design for one audience and routine | One dashboard for everyone |
| Show five to eight measures that drive action | Dozens of charts because they are available |
| Put the most important tile top left | Random arrangement |
| Use simple charts: bars, numbers, short tables | Three-dimensional pie charts and dense gauges |
| Label measures and date ranges clearly | Unlabeled numbers with unknown filters |
| Let people click through to the records | Totals with no way to see what is behind them |
Click-through is important. When Darnell sees four deals past their stage limit, he can click the tile and see which ones, open them and read the next steps before the meeting. A dashboard that shows a worrying number without letting people find the records behind it invites argument rather than action.
How reports mislead
Reports are only as good as the data and the design behind them. Several traps are common.
Bad data produces confident wrong answers. If close dates are stale, a "closing this month" report is fiction. If loss reasons are left blank, a "why we lose" chart shows mostly blanks. Lesson 6 matters here: data quality comes before reporting.
Averages hide spread. An average deal size of about 20,000 dollars might come from many 5,000-dollar printer deals and a few 100,000-dollar school projects. A report that also shows the range, or the median (the middle value), gives a truer picture.
Counting activity rewards activity. A report that ranks sellers by calls logged will produce more logged calls, not necessarily more customers. Measures should be chosen with an eye on what behavior they will encourage, which is why Ridgeline's activity tiles sit next to outcomes such as meetings booked.
Small numbers swing. A rep whose win rate moved from 50 in 100 to 25 in 100 may have won one deal out of two last month and one out of four this month. That is not yet a trend.
Different definitions produce different numbers. If one manager counts a deal as new pipeline when it is created and another only when it reaches Discover, their reports will disagree. Sales operations teams keep written definitions of each measure for this reason.
Reports and dashboards in retail
Juniper & Pine's reports come mostly from the point-of-sale system. Bev's daily dashboard shows sales by department and associate, the number of transactions, average ticket (sales divided by transactions), the protection plan attach rate (plans sold divided by eligible items sold) and new customer profiles created. Weekly, she looks at open special orders, deliveries scheduled and follow-up tasks overdue in the clienteling app.
Worked problem
Reading Bev's daily numbers
On a Saturday, Juniper & Pine recorded 86 transactions with total sales of 61,920 dollars. Of 52 eligible furniture and appliance items sold, 19 had a protection plan added. Associates created 58 new customer profiles. What were the average ticket and the attach rate, and what fraction of transactions created a new profile?
Show solution
- Average ticket.
- \[61920 \div 86 = 720\]
- Attach rate.
- \[19 \div 52 \approx 0.365\]
- New profiles per transaction.
- \[58 \div 86 \approx 0.67\]
Answer: The average ticket was 720 dollars, about 37 in 100 eligible items had a protection plan, and about two-thirds of transactions created a new customer profile. Bev compares each number with the same day last year and with the store's targets before deciding what to coach.
Aiden learned to read his own numbers in the same way: not as a scorecard, but as a set of questions. When his attach rate was lower than the team's for two weeks running, Bev did not tell him to push plans harder. She asked him to role-play how he explained them, and they found that he was mentioning them only at the register, after the customer had already decided on the total price. SLS-256 covers selling add-ons ethically.
A seller's own dashboard
Dashboards are not only for managers. Many sellers find a personal dashboard the quickest way to start each week. Maya's has five tiles: her open opportunities by stage; deals closing in the next 30 days with their next steps; deals past their stage limit; her overdue tasks; and new leads assigned to her that she has not yet contacted. Every tile points to work she can do today. She left out tiles that only describe the past, such as last quarter's results, because she sees those in Darnell's monthly review and cannot change them.
A personal dashboard is also a good place to practice reading data critically. When the "closing in the next 30 days" tile showed seven deals in October, Maya clicked through and realized that three of them had close dates she had entered optimistically in August and never revisited. The tile was technically correct and practically misleading. She updated the dates, and the tile dropped to four deals, all of which she believed in.
Scheduling and sharing reports
Reports can be scheduled to arrive by email or in a team chat channel at a set time, which saves people from having to remember to run them. Scheduled reports should go only to people who need them and can act on them. A report that lands in twenty inboxes every morning and is read by two people adds noise, and if it contains customer details it also spreads personal information more widely than necessary. Grace reviews Ridgeline's scheduled reports twice a year and removes those nobody opens.
Common mistakes
MistakeA dashboard should show every measure the CRM can produce.
InsteadShow a few measures that the audience can act on, designed for a specific routine.
MistakeAn open pipeline report shows how much the team will close.
InsteadIt shows what is open now; predicting what will close needs history and judgment.
MistakeWhen a report looks wrong, the data must be wrong.
InsteadCheck the filters, date range and definitions first; many surprises come from report design.
MistakeAverages are enough to understand deal sizes.
InsteadAverages hide spread; look at the range or the median as well.
MistakeRanking sellers by activity counts improves performance.
InsteadActivity counts encourage logging activity; pair them with outcome measures and coaching.
Summary and key terms
- List views are for working through records, reports answer specific questions, and dashboards collect summaries for regular monitoring.
- A report is built by choosing a report type, filters, columns, grouping and summaries, and optionally a chart.
- Filters cause most report errors; check them, and the date range and definitions, before trusting a surprising number.
- Good dashboards serve one audience and routine, show a few actionable measures, put the most important first and allow click-through.
- Leading indicators help manage the week; lagging indicators confirm results.
- Reports mislead through bad data, averages that hide spread, activity counts that distort behavior, small numbers and inconsistent definitions.
- List view
- A filtered list of records of one type that users can sort and edit.
- Report
- A query that selects, groups and summarizes records to answer a question.
- Dashboard
- A page of summaries and charts fed by reports.
- Filter
- A condition that decides which records a report includes.
- Leading indicator
- A measure of activity or conditions that tend to come before results.
- Lagging indicator
- A measure of results that have already happened.
- Average ticket
- Total sales divided by the number of transactions.
Practice problems
Work each problem on paper first, then reveal the answer to check.
Which filter would exclude an open opportunity with no close date from a "closing this quarter" report?
Show answer
The filter on close date; records with an empty close date do not meet it.
Is "meetings booked" a leading or lagging indicator?
Show answer
Leading: it comes before results such as closed deals.
A store had 120 transactions and 84,000 dollars in sales. What was the average ticket?
Show answer
84,000 divided by 120 is 700 dollars.
Give one reason a dashboard should allow click-through to the records.
Show answer
So people can see which records are behind a number and act on them, rather than arguing about the total.
Lesson quiz · 5 questions
Score 60% or more to complete this lesson.
Create a free account to save your progress, take quizzes and earn a certificate.