
ROB-440 · Lesson 7 of 12 · 31 min
Machine vision in automation
Machine vision gives automated systems the ability to find, measure, read and inspect parts. In industrial robotics it serves two broad purposes: guiding robots to parts whose position varies, and inspecting products so that defects are caught before they reach customers. ROB-330 covered the computer vision theory behind both, from the pinhole camera model and calibration to feature matching, depth sensing and learning-based detection, and its capstone sized a camera and lens for a pick-and-place cell. This lesson takes the factory engineer's view: which kind of vision system fits which task, how lighting makes or breaks an application, how to size resolution for inspection and line-scan imaging, how robots pick parts from moving conveyors, and how to judge whether an inspection system is good enough by measuring its error rates and its measurement capability.
What vision does on the factory floor
Industrial vision tasks fall into a few categories. Location finds a part's position and orientation for a robot, or checks that it is correctly placed. Inspection checks for defects: scratches, missing components, wrong colors, contamination, incomplete welds or bad seals. Measurement, often called gauging, determines dimensions to a tolerance. Identification reads barcodes, two-dimensional codes such as Data Matrix and QR, or printed characters through optical character recognition (OCR), increasingly to meet traceability requirements in automotive, medical device, pharmaceutical and food production. Many applications combine several: a system might locate a part, read its serial code, check that all components are present and send coordinates to a robot, all in one image.
| Task | Example | Typical technique | Key requirement |
|---|---|---|---|
| Presence and absence | Are all eight screws installed? | Blob analysis, pattern matching | Consistent lighting and contrast |
| Location and guidance | Where is the bracket on the conveyor? | Geometric pattern matching, 3D matching | Calibration to robot coordinates |
| Gauging | Is the hole diameter 8.00 ± 0.05 mm? | Edge detection with sub-pixel fitting | Resolution, telecentric optics, temperature stability |
| Defect inspection | Is there a scratch on the painted panel? | Rule-based filters or deep learning | Representative defect samples and lighting that reveals defects |
| Identification | Read the Data Matrix code on each part | Code readers, OCR | Code quality and resolution |
| Verification | Is the label for the correct product? | OCR, pattern and color checks | Link to the production order in the MES |
Types of vision systems
Smart cameras integrate the image sensor, processor, software and communication in one housing and are configured through a graphical tool rather than programmed. They suit single-camera inspections and simple robot guidance. PC-based systems connect one or more industrial cameras, over interfaces such as GigE Vision or USB3 Vision, to an industrial computer running a vision library or application, and suit multi-camera systems, demanding algorithms and deep learning. Dedicated code readers are optimized for barcodes and two-dimensional codes. Three-dimensional sensors produce depth maps or point clouds: laser triangulation profilers measure a profile line by line as parts move under them, structured-light sensors project patterns to capture a full 3D snapshot of a stationary scene, stereo cameras match features between two views, and time-of-flight cameras measure the round-trip time of modulated light. ROB-330 explained the principles; in practice, profilers dominate inline 3D measurement on conveyors, structured light dominates bin picking, and time-of-flight is common for coarse tasks such as detecting box positions on pallets.
Lighting is the first design decision
Experienced vision engineers say that most failed applications fail because of lighting, not software. The goal is an image in which the feature of interest has strong, consistent contrast against everything else, regardless of variations in part color, ambient light and surface finish. Lighting geometry, color and filtering are chosen to create that contrast before any algorithm runs.
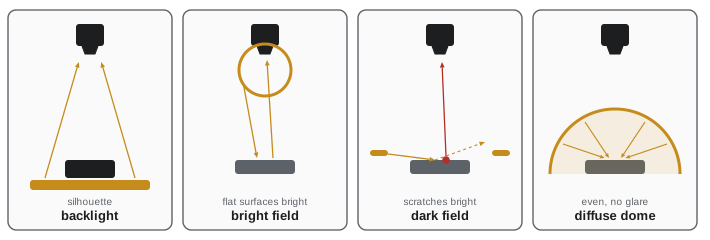
| Lighting technique | How it works | Good for |
|---|---|---|
| Backlight | Light behind the part; the camera sees a silhouette | Outline gauging, hole presence, transparent containers |
| Bright field | Light near the camera axis reflects directly into the lens from flat surfaces | Print, labels, flat matte parts |
| Dark field | Low-angle light grazes the surface; only raised or scratched features scatter light into the lens | Scratches, embossed characters, edges on shiny parts |
| Diffuse dome or cloudy day | Even light from all directions removes glare and shadows | Curved shiny parts, foil packs, reading codes on reflective surfaces |
| Coaxial | Light enters along the camera axis through a beam splitter | Flat reflective surfaces such as wafers and machined faces |
| Structured light | Projected lines or patterns reveal shape | 3D measurement and surface form |
Color helps too. A red LED light makes red features appear bright and green ones dark on a monochrome camera; a filter matching the light's wavelength on the lens blocks ambient light from windows and overhead lamps. Strobing the light in short, bright pulses freezes motion on moving lines and overwhelms ambient light. Infrared and ultraviolet lighting reveal features invisible to the eye, such as UV-fluorescent adhesive beads that confirm glue is present.
Resolution for inspection and gauging
Resolution requirements depend on the task. A common rule of thumb for defect detection is that the smallest defect should cover at least about 3 to 4 pixels across, so that it is distinguishable from noise. For gauging, a rule is that the pixel size should be about one-tenth of the tolerance band or smaller, although sub-pixel edge fitting can do better under good conditions. For reading codes, manufacturers specify a minimum number of pixels per module, the smallest cell of the code.
Worked problem
Camera resolution for a scratch inspection
Painted brackets 240 mm by 160 mm must be inspected for scratches as small as 0.25 mm wide. The field of view should be 10 percent larger than the part in each direction to allow for position variation. Using 3 pixels across the smallest defect, what sensor resolution is required?
Show solution
- Field of view: \( 264 \times 176 \) mm.
- Required pixel size on the part: \( 0.25 / 3 \approx 0.083 \) mm.
- Pixels needed: \( 264 / 0.083 \approx 3170 \) by \( 176 / 0.083 \approx 2110 \).
- A 12-megapixel sensor of about 4,096 by 3,000 pixels covers this; a 5-megapixel sensor of 2,448 by 2,048 would not.
Answer: About 3,200 by 2,100 pixels at minimum, so a sensor of around 12 megapixels, or two cameras each covering half the part.
Line-scan cameras build an image one row at a time as the product moves past, which suits continuous materials such as sheet steel, film, paper and textiles, and cylindrical parts rotated in front of the camera. The camera's line rate must match the product speed so that pixels are square on the product, and an encoder on the conveyor usually triggers each line.
Worked problem
Line-scan camera for a web inspection
A plastic film 1.2 m wide moves at 3 m/s. Defects as small as 0.3 mm must be detected with 3 pixels across. What camera width and line rate are needed?
Show solution
- Pixel size: \( 0.3/3 = 0.1 \) mm.
- Pixels across the web: \( 1200 / 0.1 = 12\,000 \), so perhaps two 8k cameras with overlap, or one 16k camera.
- Line rate: \( 3000 \text{ mm/s} / 0.1 \text{ mm} = 30\,000 \) lines per second, or 30 kHz.
- Data rate for 12,000 pixels at 30 kHz with 8 bits per pixel: \( 360 \) MB per second, which shapes the choice of interface and computer.
Answer: 12,000 pixels across at about 30 kHz, producing roughly 360 MB per second of image data.
Picking from moving conveyors
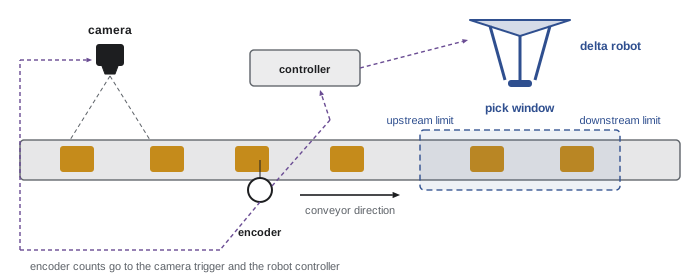
Robots often pick parts from conveyors that do not stop. A camera upstream locates each part and records the conveyor encoder count at the moment of the image. The robot controller, also reading the encoder, knows how far each part has traveled since it was seen and computes where it is now. When the part enters the robot's pick window, the robot matches the conveyor's speed, picks the part while moving with it, and leaves. Robot vendors offer conveyor tracking options that handle the coordinate transforms; the integrator calibrates the encoder scale, the camera-to-robot transform and the conveyor direction.
Worked problem
Can the robot keep up with the conveyor?
A conveyor moves at 0.4 m/s and carries randomly spaced parts averaging 90 per minute. A delta robot's pick window is 600 mm long and each pick-and-place takes 0.5 s on average. How long is each part inside the window, and what is the robot's utilization?
Show solution
- Time in window: \( 0.6 / 0.4 = 1.5 \) s per part.
- Robot capacity: \( 60 / 0.5 = 120 \) picks per minute.
- Utilization: \( 90 / 120 = 75 \) percent.
- Because arrivals are random, several parts sometimes arrive close together. With only 1.5 s in the window, some will pass unpicked; a second robot downstream, or a recirculation path, catches them.
Answer: Each part spends 1.5 s in the window and the robot is about 75 percent utilized on average; random clustering means a second robot or recirculation is still needed to approach zero misses.
# Simulating missed picks on a conveyor with random part spacing
import numpy as np
rng = np.random.default_rng(440)
def missed_share(rate_per_min, window_s, pick_s, n=200_000):
    arrivals = np.cumsum(rng.exponential(60 / rate_per_min, n))   # time each part enters window
    robot_free, missed = 0.0, 0
    for t in arrivals:
        start = max(t, robot_free)
        if start > t + window_s:          # part has left the window before robot is free
            missed += 1
        else:
            robot_free = start + pick_s
    return missed / n
for rate in (60, 90, 110):
print(f"{rate} parts/min: missed {missed_share(rate, 1.5, 0.5):.1%}")60 parts/min: missed 0.8% 90 parts/min: missed 4.5% 110 parts/min: missed 9.8%
Calibration to the robot
For guidance, image coordinates must be converted to robot coordinates. For parts on a flat surface at known height, a simple calibration uses a grid or a set of points whose positions are known in both image and robot frames, giving a planar transformation. For a camera mounted on the robot arm, a hand-eye calibration determines the transform between the camera and the flange, as ROB-330 explained. Calibration must be repeated if the camera is bumped, the lens is adjusted or the conveyor is moved, so robust installations include a quick verification check, such as picking up a reference part and confirming its position.
Deep learning inspection
Traditional rule-based vision uses explicit algorithms: threshold this region, count these blobs, measure this edge. It works well when defects are well defined and appearance is controlled. Deep learning inspection, discussed in ROB-330 for detection and segmentation, is now widely used for defects that are hard to describe with rules, such as cosmetic flaws on textured surfaces, weld appearance and natural products like food. Supervised classifiers need labeled examples of good and defective parts; anomaly detection models learn only from good parts and flag anything unusual, which helps when defects are rare. Data quality matters more than model choice: images must cover the real range of variation in parts, lighting and position, and labels must be consistent between inspectors.
Vision vendors now package deep learning tools that run on smart cameras or industrial PCs with modest training sets, sometimes a few dozen images per class to start. Validation must still follow the same discipline as any inspection system: a held-out test set, measured error rates and periodic re-checks as products and conditions drift.
Is the inspection good enough?
Every inspection system makes two kinds of errors. A false reject, a type I error, rejects a good part, wasting material and sometimes requiring manual re-inspection. A false accept, a type II error, passes a bad part to the customer, which may be far more costly. Moving the decision threshold trades one against the other, just as with the alarms in ROB-430. The right balance depends on the costs.
# Choosing an inspection threshold from score distributions and error costs
import numpy as np
rng = np.random.default_rng(440)
good = rng.normal(0.25, 0.10, 99_000)      # anomaly scores for good parts
bad = rng.normal(0.70, 0.15, 1_000)        # 1 per cent defect rate
cost_false_reject, cost_false_accept = 2.0, 150.0   # dollars per event
for thr in (0.40, 0.45, 0.50, 0.55):
    fr = np.mean(good > thr); fa = np.mean(bad <= thr)
    cost = fr * len(good) * cost_false_reject + fa * len(bad) * cost_false_accept
print(f"threshold {thr:.2f}: false reject {fr:.2%}, false accept {fa:.2%}, cost per 100k parts ${cost:,.0f}")threshold 0.40: false reject 6.86%, false accept 2.10%, cost per 100k parts $16,726 threshold 0.45: false reject 2.35%, false accept 5.80%, cost per 100k parts $13,360 threshold 0.50: false reject 0.65%, false accept 9.00%, cost per 100k parts $14,792 threshold 0.55: false reject 0.13%, false accept 16.30%, cost per 100k parts $24,716
For gauging, the question is whether the measurement system is capable of distinguishing parts within tolerance from parts outside it. Measurement system analysis, required by automotive quality standards such as IATF 16949 through the AIAG MSA manual, uses gauge repeatability and reproducibility (gauge R&R) studies: several parts are measured several times, and the variation due to the measurement system is compared with the tolerance or the process variation. A common guideline treats gauge R&R below 10 percent of tolerance as acceptable, 10 to 30 percent as possibly acceptable depending on the application, and above 30 percent as unacceptable.
Worked problem
Gauge R&R for a vision measurement
A vision system measures a slot width with tolerance 12.00 ± 0.10 mm. A gauge study finds a measurement system standard deviation of 0.004 mm. Using six standard deviations as the measurement spread, what is the gauge R&R as a percentage of tolerance?
Show solution
- Measurement spread: \( 6 \times 0.004 = 0.024 \) mm.
- Tolerance band: \( 0.20 \) mm.
- Gauge R&R: \( 0.024 / 0.20 = 12 \) percent.
Answer: 12 percent of tolerance, in the conditionally acceptable band; better lighting, telecentric optics or more pixels across the slot could bring it below 10 percent.
Common mistakes
MistakeChoosing the camera first and fixing lighting later.
InsteadDesign lighting and optics for contrast first; algorithms come after a good image.
MistakeSizing resolution by the part size alone.
InsteadSize it by the smallest defect or the tolerance, with pixels per feature rules.
MistakeIgnoring random spacing on conveyors.
InsteadSimulate arrivals; average utilization below 100 percent can still miss parts.
MistakeTraining a deep learning model on a few tidy images.
InsteadCover real variation in parts, lighting and position, and validate on held-out data.
MistakeJudging inspection by accuracy alone.
InsteadMeasure false reject and false accept rates and set thresholds by their costs; run a gauge R&R for measurements.
Summary and key terms
- Vision in automation locates, inspects, measures and identifies parts.
- Smart cameras, PC-based systems, code readers and 3D sensors each suit different tasks.
- Lighting geometry, color, filters and strobing create the contrast that makes applications reliable.
- Resolution follows the smallest defect or tolerance; line-scan line rate equals speed divided by pixel size.
- Conveyor tracking uses encoder counts to pick moving parts within a window; random arrivals cause misses.
- Deep learning handles hard-to-describe defects but needs representative data and validation.
- False rejects, false accepts and gauge R&R determine whether an inspection system is good enough.
- Smart camera
- A camera with built-in processing and vision software.
- Dark field lighting
- Low-angle illumination that makes scratches and raised features bright on a dark background.
- Backlight
- Illumination from behind the part that produces a silhouette.
- Line-scan camera
- A camera that captures one row of pixels at a time as the product moves.
- Conveyor tracking
- Robot motion synchronized to a moving conveyor using an encoder.
- False reject
- Rejecting a good part; a type I error.
- False accept
- Passing a defective part; a type II error.
- Gauge R&R
- A study of measurement system repeatability and reproducibility compared with tolerance or process variation.
Practice problems
Work each problem on paper first, then reveal the answer to check.
Which lighting reveals scratches on a shiny flat part?
Show answer
Dark field (low-angle) lighting.
Smallest defect 0.5 mm with 4 pixels across; field of view 200 mm: pixels needed?
Show answer
\( 200 / 0.125 = 1600 \) pixels.
A web moves at 2 m/s with 0.05 mm pixels. Line rate?
Show answer
\( 2000/0.05 = 40\,000 \) lines per second.
Window 0.8 m, conveyor 0.5 m/s: time in window?
Show answer
1.6 s.
Why strobe the light on a moving line?
Show answer
To freeze motion and overpower ambient light.
What does anomaly detection learn from?
Show answer
Mostly or only images of good parts.
Measurement standard deviation 0.01 mm, tolerance ±0.2 mm: gauge R&R?
Show answer
\( 0.06/0.4 = 15 \) percent.
Why might a plant accept a higher false-reject rate?
Show answer
Because false accepts reaching customers cost far more.
Lesson quiz · 5 questions
Score 60% or more to complete this lesson.
Create a free account to save your progress, take quizzes and earn a certificate.