
RCDD-110 · Lesson 7 of 12 · 24 min
Optical loss budgets
▶ Video coming soon A video version of this lesson is on the way.
The fiber decision is made, and now it has to be proved on paper. Roz asks Daniel to prepare loss budgets for every fiber link type at Harbourview: the riser backbone to each floor, the 400 m campus link to the college building, and the short data room links. 'A loss budget answers two questions,' she says. 'Will the application work over this link, and what should the tester show when the link is installed? If you cannot answer both, you have not finished the design.'
An optical loss budget is a calculation of the maximum loss a fiber link is expected to have, built from the length of fiber, the number of connections and splices, and the allowed loss for each. Designers use it to check that planned links will support the intended applications, and installers and inspectors use it as the pass or fail limit for field testing. This lesson shows how to build one, how it relates to application limits and how it connects to testing.
The parts of a link
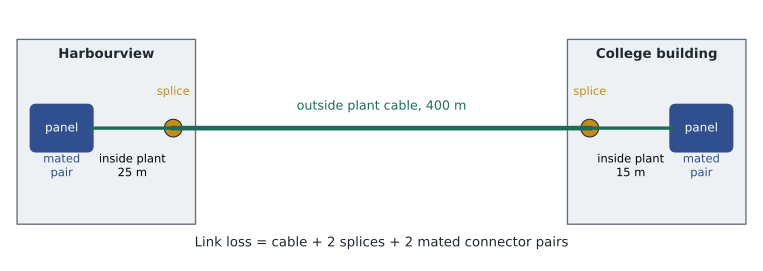
A fiber link runs from one patch panel or termination point to another. Along the way it contains cable, which loses a fixed amount per kilometer at each wavelength; connections, usually a mated pair of connectors in an adapter at each patch panel; and possibly splices, where two fibers are joined permanently, for example where a pigtail is spliced to a cable or an outside plant cable is spliced to an indoor cable at a building entrance. Each of these contributes to the total loss.
Standards set maximum allowed values for each part. These are the values a designer uses when building a budget for compliance testing, because they guarantee that any standards-compliant components, correctly installed, will pass. The current TIA optical fiber component standard uses the following maximum values, and many owners adopt them directly.
| Component | Maximum allowance used for design |
|---|---|
| Multimode cable at 850 nm | 3.5 dB per km |
| Multimode cable at 1300 nm | 1.5 dB per km |
| Singlemode cable, inside plant (1310 and 1550 nm) | 1.0 dB per km |
| Singlemode cable, outside plant (1310 and 1550 nm) | 0.5 dB per km |
| Mated connector pair | 0.75 dB |
| Splice (fusion or mechanical) | 0.3 dB |
Manufacturers often publish much lower typical values, such as 0.15 to 0.3 dB for a good connection or 0.05 dB for a fusion splice, and some offer 'low-loss' connectors with guaranteed maximums well under the standard's value. A designer may use those lower values for an application check if the specification requires those products, but the compliance test limit should be clearly stated so that no one argues about it later.
Building the budget
The calculation is simple addition: cable loss plus connection loss plus splice loss. Calculate it separately for each wavelength the link will be tested at, because cable loss differs by wavelength.
Here \(\alpha\) is the cable attenuation coefficient in dB per kilometer, \(L\) is the length in kilometers, \(N_c\) is the number of mated connector pairs and \(N_s\) is the number of splices. Count connections carefully. A link from patch panel to patch panel has one mated pair at each end, so \(N_c = 2\). The equipment cords that plug into transceivers are not part of the link and are not counted.
Worked problem
A riser backbone link
An OM4 multimode backbone link is 62 m long with a mated connector pair at each patch panel and no splices. What is the loss budget at 850 nm and at 1300 nm?
Show solution
- Cable at 850 nm: 3.5 × 0.062 = 0.217 dB.
- Connections: 2 × 0.75 = 1.50 dB.
- Total at 850 nm: 0.217 + 1.50 ≈ 1.72 dB.
- Cable at 1300 nm: 1.5 × 0.062 = 0.093 dB, so total at 1300 nm ≈ 1.59 dB.
Answer: About 1.72 dB at 850 nm and 1.59 dB at 1300 nm. In a short link the connections dominate the budget.
Worked problem
The campus link
The campus link is a singlemode cable of 400 m outside plant, spliced at each building entrance to indoor pigtails, with 25 m of inside plant cable in Harbourview and 15 m in the college building. Each end has a mated connector pair at the patch panel. What is the budget at 1310 nm?
Show solution
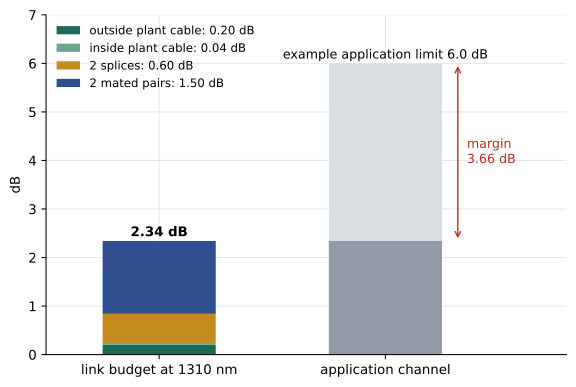
- Outside plant cable: 0.5 × 0.400 = 0.20 dB.
- Inside plant cable: 1.0 × 0.040 = 0.04 dB.
- Splices: 2 × 0.3 = 0.60 dB.
- Connections: 2 × 0.75 = 1.50 dB.
- Total: 0.20 + 0.04 + 0.60 + 1.50 = 2.34 dB.
Answer: About 2.34 dB. Even over 440 m, singlemode cable contributes only a tenth of the total; splices and connections make up the rest.
Checking against the application
The loss budget tells you what the link should measure. To know whether an application will work, compare it with the application's channel insertion loss limit, published in the application standard, such as an IEEE Ethernet specification. Each optical application specifies a maximum channel insertion loss and a maximum length for each fiber type. The channel includes the link plus any additional connections in cords, so the designer must make sure the link loss plus any extra connections fits within the application limit.
Short-reach multimode applications at high speeds have very tight loss limits, often below 2 dB for the whole channel. For example, a common 10 gigabit multimode application allows roughly 2.6 dB over 300 m of OM3, and some 100 gigabit multimode applications allow less than 2 dB over 100 m of OM4. A link built with two standard 0.75 dB connections already uses most of that, and a third connection, such as an interconnect patch panel, can make the channel fail even though each component meets the standard. This is one reason data centers use low-loss connectors and limit the number of connections in each channel.
Worked problem
Will the application work?
A data room channel uses 45 m of OM4 at 850 nm and three mated connector pairs, all low-loss connectors with a guaranteed maximum of 0.35 dB. The application allows 1.9 dB of channel insertion loss. Does it fit?
Show solution
- Cable: 3.5 × 0.045 = 0.16 dB.
- Connections: 3 × 0.35 = 1.05 dB.
- Total: 1.21 dB, which is 0.69 dB below the 1.9 dB limit.
- With standard 0.75 dB connectors the total would be 0.16 + 2.25 = 2.41 dB, which fails.
Answer: With low-loss connectors the channel fits with about 0.7 dB to spare; with standard maximum connectors it would not.
The power budget view
Transceiver data sheets describe the same thing from the electronics side. The power budget is the difference between the minimum launch power of the transmitter and the receiver's sensitivity, the lowest power at which it meets its error-rate target. Application standards subtract allowances for dispersion and other penalties from this to arrive at the channel insertion loss limit. If you work from a data sheet, remember that the vendor's 'link margin' is only meaningful if they used conservative values for every loss, as Daniel found in Lesson 2.
Testing against the budget
Fiber links are certified with a light source and power meter set, often called an optical loss test set, measuring insertion loss at each wavelength. The result is compared with the loss budget calculated for that link. The test method matters. TIA and ISO test procedures define how reference cords are set up before measuring. The method recommended for most premises links uses a single reference cord at the source when setting the zero reference, so that the measurement includes the loss of the connections at both ends of the link. Using a different referencing method can hide one or both end connections and make a bad link look good, so the test report must state the method.
For multimode fiber, the way light is launched into the fiber affects the result, because different light sources fill the modes differently. Current test standards require an encircled flux compliant launch condition, usually achieved with a special launch cord or controller, so that results from different testers agree. Testing without it can give results that differ by several tenths of a decibel, enough to pass a bad link or fail a good one.
An optical time domain reflectometer (OTDR) adds a second level of certification. It sends pulses down the fiber and measures the light scattered and reflected back over time, building a picture of loss along the length. An OTDR trace shows where each connection and splice is and how much loss each contributes, which a power meter cannot. Owners often require OTDR testing for backbone and campus links, where it helps locate faults and documents the as-built condition for future repairs.
Documenting the budget
The design documents should list, for each link or group of similar links, the length, the number of connections and splices, the wavelengths to test, the calculated budget and the test method and launch condition required. The installer's report then shows the measured value next to the budget. Owners increasingly ask for the calculation itself to be included so that future changes, such as adding a patch panel, can be checked quickly.
Daniel's budgets go into a table in the design basis. The riser links come out at about 1.6 to 1.8 dB, the campus link at 2.34 dB at 1310 nm and slightly less at 1550 nm, and the data room channels are designed with low-loss connectors so that the most demanding multimode applications the network team expects will fit. Roz signs off on the table with one addition: a note that every connection must be inspected and, if necessary, cleaned before testing, with inspection images kept for a sample of ports.
Exam focus: budget arithmetic traps
Loss budget questions are straightforward arithmetic, but a few traps recur. Convert meters to kilometers before multiplying by the attenuation coefficient: 300 m is 0.3 km, not 300. Count mated pairs, not connectors: a link with a connector at each end of each panel has one mated pair at each panel. Count splices separately from connections. And use the wavelength the question asks for, because multimode loss at 850 nm is more than twice the loss at 1300 nm.
Worked problem
Finding a fault from a budget
An OS2 inside plant link of 120 m with two connections has a budget of 1.62 dB at 1310 nm. The installer measures 2.9 dB at 1310 nm and 3.6 dB at 1550 nm. What do the results suggest?
Show solution
- The measured loss exceeds the budget at both wavelengths, so the link fails.
- Loss is noticeably higher at 1550 nm than at 1310 nm, which is the signature of a bend, because bend loss rises with wavelength.
- An OTDR trace would locate the bend so it can be relieved, and the connectors should also be inspected and cleaned.
Answer: A tight bend or crushed section is likely. Fix it, clean and inspect the connectors, and retest.
Common mistakes
MistakeCounting equipment cords as part of the link budget.
InsteadA link budget covers the fixed link between termination points. Equipment cords are part of the channel, not the link.
MistakeUsing typical data sheet values for compliance limits.
InsteadUse the standard's maximum values, or the guaranteed maximum of a specified product, for test limits.
MistakeTesting only one wavelength.
InsteadTest multimode links at 850 and 1300 nm and singlemode links at 1310 and 1550 nm, unless the specification says otherwise. Bend problems show more at longer wavelengths.
MistakeIgnoring the reference method.
InsteadThe referencing method changes which connections are included. State the method in the specification and on the report.
Summary and key terms
- A loss budget adds cable loss, connection loss and splice loss using standard maximum values for each.
- Common TIA design values are 3.5 and 1.5 dB per km for multimode, 1.0 and 0.5 dB per km for inside and outside plant singlemode, 0.75 dB per connection and 0.3 dB per splice.
- In short links, connections dominate; in long outside plant links, splices and connections still contribute most of the budget.
- Application standards set channel insertion loss limits that can be tighter than the sum of standard component allowances, so high-speed channels may need low-loss connectors.
- Certification uses a power meter and light source with a defined reference method and, for multimode, an encircled flux launch; OTDRs document loss along the link.
- Loss budget
- The calculated maximum insertion loss of a fiber link, used for design checks and as a test limit.
- Channel insertion loss limit
- The maximum end-to-end loss an application allows for a given fiber type and length.
- Optical loss test set
- A light source and power meter used to measure insertion loss of a fiber link.
- Encircled flux
- A defined launch condition for multimode testing that controls how the modes are filled.
- OTDR
- Optical time domain reflectometer: an instrument that measures loss and reflections along a fiber from one end.
- Fusion splice
- A permanent joint made by melting two fibers together, with very low loss.
Practice problems
Work each problem on paper first, then reveal the answer to check.
An OS2 inside plant link is 150 m long with two connections. What is its budget at 1310 nm?
Show answer
1.0 × 0.150 = 0.15 dB plus 1.50 dB for connections = 1.65 dB.
A multimode link of 300 m has two connections and one splice. What is its budget at 850 nm?
Show answer
3.5 × 0.3 = 1.05 dB, plus 1.50 dB, plus 0.30 dB = 2.85 dB.
Why might a link that meets its budget still not support an application?
Show answer
The application's channel loss limit may be lower than the budget, and the channel includes any additional cord connections.
Lesson quiz · 5 questions
Score 60% or more to complete this lesson.
Create a free account to save your progress, take quizzes and earn a certificate.