
PYTH-240 · Lesson 7 of 12 · 25 min
Automating spreadsheets
▶ Video coming soon A video version of this lesson is on the way.
Spreadsheets run small businesses. At Ridgeline, Anita keeps the books in a workbook with one sheet per month, Theo plans stock in another, and Kai's roast plan lives in a third. Every Monday, numbers move between these workbooks and the services from earlier lessons by copy and paste: online sales from the shop into Anita's sheet, supplier prices into Kai's plan, delivery dates from the carrier into Theo's tracker. A script can read and write spreadsheets directly, which removes the copying, the typos that come with it and the hour it takes.
This lesson shows how spreadsheet ideas map onto Python: workbooks, sheets, cells, ranges and formulas. It works with CSV, which every spreadsheet program opens, and with real Excel workbooks through the openpyxl library. It covers building summaries such as pivot tables in plain Python, writing formulas and formatting, handling spreadsheet dates, reconciling two sources, and a security issue every exporter must know about: formula injection.
openpyxl is a third-party package and is not available to the browser Python on this page, so listings that use it are shown without a Run button. The calculations around them, which are where the logic lives, run here in plain Python.
Workbooks, sheets, cells and ranges
A spreadsheet file is a workbook containing one or more worksheets. Each worksheet is a grid of cells, addressed by a column letter and a row number in what is called A1 notation: A1 is the top-left cell, C7 is the third column of the seventh row, and after Z come AA, AB and so on, up to XFD, the 16,384th column in current Excel files. A rectangular block of cells is a range, written with a colon: B2:B8 is seven cells of column B. A cell holds a value, such as a number, text or date, or a formula, which starts with an equals sign and is calculated by the spreadsheet program, such as =SUM(B2:B8).
Programs usually prefer row and column numbers to letters, so converting between the two is a common small task. Column letters work like a number written in base 26, except that there is no zero digit: A is 1, Z is 26, AA is 27. The listing converts in both directions.
def col_number(letters):
    n = 0
    for ch in letters.upper():
        n = n * 26 + (ord(ch) - ord("A") + 1)
    return n

def col_letters(n):
    out = ""
    while n:
        n, r = divmod(n - 1, 26)
        out = chr(ord("A") + r) + out
    return out

for letters in ("A", "Z", "AA", "AZ", "BA", "XFD"):
print(letters, col_number(letters), col_letters(col_number(letters)))A 1 A Z 26 Z AA 27 AA AZ 52 AZ BA 53 BA XFD 16384 XFD
Try it yourself
Cell names
Write cell_name(row, col) that returns the A1-style name of a cell given its row and column numbers, both starting at 1. For example, cell_name(1, 1) is "A1", cell_name(7, 3) is "C7" and cell_name(2, 28) is "AB2".
def cell_name(row, col):
    return chr(ord('A') + col - 1) + str(row)

print(cell_name(2, 28))
CSV or Excel?
For moving data between programs, CSV is often the best choice: every spreadsheet program, database and language reads it, it is plain text that version control can compare, and lesson 4 showed how to read and write it safely. Its limits are just as clear. A CSV file holds one table of plain values: no formulas that stay live, no formatting, no multiple sheets, no charts. When a person will open the result and work in it, or when the source is a workbook with several sheets and formulas, use the real format.
For Excel's .xlsx files, the standard Python library is openpyxl, installed with python -m pip install openpyxl. It reads and writes workbooks without needing Excel installed, so it runs on servers. The pandas library, popular for data analysis, reads and writes spreadsheets too and is handy when the work is mostly calculation on tables. Google Sheets has its own API, which uses the OAuth tokens of lesson 3 and the REST patterns of lesson 2.
Reading a workbook with openpyxl
Anita's workbook has a sheet named Nov 2026 with a header row and one row per day: date, till sales, online sales, refunds and a formula column for the net total. Reading it takes a few lines. load_workbook opens the file, the workbook is indexed by sheet name, and iter_rows walks the rows, returning values when values_only=True. One detail trips up everyone once: by default, a formula cell gives back the formula text, such as =B2+C2-D2, not its result. Opening with data_only=True returns the result instead, as calculated the last time the file was saved by a spreadsheet program; openpyxl itself never calculates formulas.
from openpyxl import load_workbook

wb = load_workbook("ridgeline-books-2026.xlsx", data_only=True)   # results, not formula text
ws = wb["Nov 2026"]
print(ws.dimensions)                                               # e.g. A1:E31

days = []
for date, till, online, refunds, net in ws.iter_rows(min_row=2, values_only=True):
    if date is None:
        break                                                      # stop at the first empty row
    days.append({"date": date, "till": till, "online": online, "refunds": refunds, "net": net})
print(len(days), "days read; first:", days[0])
Summaries and pivot tables in Python
The most common spreadsheet job is summarizing: totals per day, per product, per channel. In a spreadsheet this is a pivot table; in Python it is a dictionary of totals, usually built with collections.defaultdict or Counter. The listing turns a week of online order lines from the shop into a cross-tabulation with one row per coffee and one column per day, plus totals, the table Theo used to build by hand.
from collections import defaultdict
from decimal import Decimal

lines = [("Mon", "RC-101", 4), ("Mon", "RC-104", 1), ("Tue", "RC-101", 2), ("Tue", "RC-102", 3),
         ("Wed", "RC-104", 2), ("Thu", "RC-101", 5), ("Thu", "RC-102", 1), ("Fri", "RC-106", 2),
         ("Sat", "RC-101", 7), ("Sat", "RC-104", 1), ("Sun", "RC-106", 1)]
days = ["Mon", "Tue", "Wed", "Thu", "Fri", "Sat", "Sun"]

table = defaultdict(lambda: defaultdict(int))
for day, sku, bags in lines:
    table[sku][day] += bags

print("SKU    " + "".join(f"{d:>5}" for d in days) + "  Total")
for sku in sorted(table):
    row = [table[sku][d] for d in days]
    print(f"{sku:7}" + "".join(f"{n:>5}" for n in row) + f"{sum(row):>7}")
col_totals = [sum(table[s][d] for s in table) for d in days]
print("Total " + "".join(f"{n:>5}" for n in col_totals) + f"{sum(col_totals):>7}")SKU Mon Tue Wed Thu Fri Sat Sun Total RC-101 4 2 0 5 0 7 0 18 RC-102 0 3 0 1 0 0 0 4 RC-104 1 0 2 0 0 1 0 4 RC-106 0 0 0 0 2 0 1 3 Total 5 5 2 6 2 8 1 29
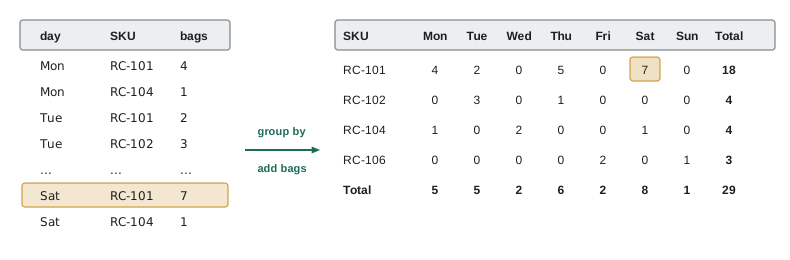
Try it yourself
Totals by channel
Anita's sales arrive as a list of tuples (day, channel, amount), where amount is a string such as "18.50". Write channel_totals(sales) that returns a dictionary mapping each channel to its total as a Decimal. The channels are not known in advance.
def channel_totals(sales):
    totals = {}
    for day, channel, amount in sales:
        totals[channel] = float(amount)
    return totals

print(channel_totals(SALES))
Once the totals exist as Python data, writing them out is easy, and CSV is the quickest route into anyone's spreadsheet program. The listing writes the pivot from above as a CSV file that opens with one column per day. Writing the header from the same days list used to build the table guarantees the columns line up, and adding the totals as a final row keeps the file readable for a person while staying simple for any program that reads it later.
import csv, io

days = ["Mon", "Tue", "Wed", "Thu", "Fri", "Sat", "Sun"]
table = {"RC-101": {"Mon": 4, "Tue": 2, "Thu": 5, "Sat": 7}, "RC-104": {"Mon": 1, "Wed": 2, "Sat": 1}}

out = io.StringIO()                       # a real script: open("week-45.csv", "w", newline="")
writer = csv.writer(out, lineterminator="\n")
writer.writerow(["SKU"] + days + ["Total"])
for sku in sorted(table):
    row = [table[sku].get(d, 0) for d in days]
    writer.writerow([sku] + row + [sum(row)])
totals = [sum(table[s].get(d, 0) for s in table) for d in days]
writer.writerow(["Total"] + totals + [sum(totals)])
print(out.getvalue())SKU,Mon,Tue,Wed,Thu,Fri,Sat,Sun,Total RC-101,4,2,0,5,0,7,0,18 RC-104,1,0,2,0,0,1,0,4 Total,5,2,2,5,0,8,0,22
Automation that touches the books needs to be trustworthy, and three habits make it so. First, never overwrite the only copy: write to a new file, or keep the previous version, so a bug cannot destroy a month of records. Second, check totals both ways: if the script copies 31 days of sales, it should also confirm that its grand total equals the sum of the source rows, and stop if it does not. Third, leave a trail: a short line in a log, or a note cell in the sheet, saying which script wrote the data and when, so that anyone who finds a surprising number knows where it came from.
Writing a workbook people will use
A report that people will open in Excel should look like one. openpyxl creates a Workbook, adds sheets, writes values with ws.append(row) or by assigning to ws["B2"], and saves with wb.save(path). It can also write formulas, as strings starting with an equals sign, so that the totals in the sheet stay live when someone edits a number; apply number formats so money shows two decimals and dates look like dates; bold the header row; set column widths; and freeze the header so it stays visible while scrolling. The listing writes Theo's weekly table with all of these touches.
from openpyxl import Workbook
from openpyxl.styles import Font
from openpyxl.utils import get_column_letter

rows = [("RC-101", 18.50, 18), ("RC-102", 22.00, 4), ("RC-104", 20.25, 4), ("RC-106", 21.50, 3)]
wb = Workbook()
ws = wb.active
ws.title = "Week 45"
ws.append(["SKU", "Price", "Bags sold", "Revenue"])
for r, (sku, price, bags) in enumerate(rows, start=2):
    ws.append([sku, price, bags, f"=B{r}*C{r}"])            # live formula per row
last = len(rows) + 1
ws.append(["Total", None, f"=SUM(C2:C{last})", f"=SUM(D2:D{last})"])
for cell in ws[1]:
    cell.font = Font(bold=True)
for row in ws.iter_rows(min_row=2, min_col=2, max_col=4):
    row[0].number_format = row[2].number_format = "#,##0.00"
for col in range(1, 5):
    ws.column_dimensions[get_column_letter(col)].width = 12
ws.freeze_panes = "A2"                                        # keep the header visible
wb.save("week-45.xlsx")
Writing formulas rather than computed numbers is a choice. Formulas keep the sheet consistent when a person edits it, which suits planning sheets. Computed numbers are safer for reports that should be a fixed record of what the script found, and they can be checked in Python before writing. Theo's table uses formulas because he adjusts the quantities by hand; Anita's month-end export writes values, because the books must not change after they are closed.
Dates in spreadsheets
Spreadsheet programs store dates as numbers: the count of days since a starting point, with the time of day as a fraction. In Excel's usual system, day 1 is 1 January 1900, and because of an old compatibility quirk, the practical way to convert is to count days from 30 December 1899. openpyxl converts cells formatted as dates into Python datetime objects for you, but dates arriving as bare numbers, from a CSV export or an older system, need converting by hand, as does any number you suspect is really a date.
from datetime import date, datetime, timedelta

EPOCH = datetime(1899, 12, 30)

def from_serial(serial):
    return EPOCH + timedelta(days=serial)

def to_serial(d):
    return (datetime(d.year, d.month, d.day) - EPOCH).days

print(from_serial(46000).date())
print(from_serial(46000.75))              # 18:00 on the same day
print(to_serial(date(2026, 11, 9)))2025-12-09 2025-12-09 18:00:00 46335
Formula injection
Exporting data to CSV for a spreadsheet has a security trap. If a cell value begins with =, +, - or @, spreadsheet programs may treat it as a formula when the file is opened. A customer who types =HYPERLINK("http://example.invalid","Click") as their company name on an order form could make that link appear in Anita's export, and some formulas can do worse when a user accepts the program's prompts. This is called formula injection or CSV injection. Any export that includes text typed by outside people, such as names, notes or addresses, should neutralize such values, commonly by putting a single quote in front, which spreadsheet programs treat as "this is text".
RISKY = ("=", "+", "-", "@", "\t", "\r")

def safe_cell(value):
    text = str(value)
    if text.startswith(RISKY):
        return "'" + text
    return text

for v in ["Lee, Ana", "=HYPERLINK(\"http://example.invalid\",\"Click\")", "+1 403 555 0100", "@SUM(A1)", 42]:
print(repr(safe_cell(v)))'Lee, Ana'
'\'=HYPERLINK("http://example.invalid","Click")'
"'+1 403 555 0100"
"'@SUM(A1)"
'42'Neutralizing changes how a number such as -3 or a phone number written with a plus sign looks, so apply it to free-text fields typed by outsiders, not to columns of numbers your own program calculated. When writing a real .xlsx file with openpyxl, a value stored as text in a cell is not run as a formula unless it is a string starting with an equals sign, so the same rule applies: never write text from outside sources into a cell as-is if it might begin with =.
Try it yourself
Make an export safe
Write safe_row(row) that takes a list of values from a customer record and returns a new list of strings in which every value that starts with =, +, - or @ has a single quote added in front. Other values are converted to strings unchanged.
def safe_row(row):
    return [str(v) for v in row]

print(safe_row(['Okafor', '=1+2', 7]))
Reconciling two sources
A valuable automation is reconciliation: checking that two sources agree. Anita compares the shop's daily online totals with the payment processor's deposits; Theo compares the bags the stock sheet says were sold with the bags the shop recorded. A script lines the two up by date or by SKU, computes the differences, and reports only the rows that disagree, which turns an hour of eyeballing into a short list of things to investigate.
from decimal import Decimal

shop = {"11-02": "212.50", "11-03": "98.75", "11-04": "143.00", "11-05": "77.25"}
deposits = {"11-02": "212.50", "11-03": "95.50", "11-05": "77.25", "11-06": "40.00"}

for day in sorted(shop.keys() | deposits.keys()):
    a = Decimal(shop.get(day, "0"))
    b = Decimal(deposits.get(day, "0"))
    if a != b:
        note = "missing deposit" if day not in deposits else "no shop sales" if day not in shop else "amounts differ"
print(f"{day} shop {a:>7} deposits {b:>7} difference {a - b:>7} {note}")11-03 shop 98.75 deposits 95.50 difference 3.25 amounts differ 11-04 shop 143.00 deposits 0 difference 143.00 missing deposit 11-06 shop 0 deposits 40.00 difference -40.00 no shop sales
The union of the two key sets, shop.keys() | deposits.keys(), makes sure days present in only one source are reported too, which is where the most interesting problems hide. On 3 November the difference of 3.25 turned out to be a refund the shop recorded the next day; on 4 November a whole deposit was missing because of a bank holiday; the 6 November deposit without shop sales was a correction.
Common mistakes
MistakeReading a workbook and getting formula text such as =B2+C2 instead of numbers.
InsteadOpen it with data_only=True to read the results last saved by a spreadsheet program.
MistakeAssuming openpyxl calculates formulas.
InsteadIt only stores them; the spreadsheet program calculates them when the file is opened.
MistakeExporting customer-typed text to CSV without neutralizing it.
InsteadPrefix values that start with =, +, - or @ with a single quote.
MistakeTreating a spreadsheet date that arrives as 46000 as a plain number.
InsteadConvert serial dates from 30 December 1899.
MistakeUsing CSV for a report that needs several sheets, formulas and formatting.
InsteadWrite a real .xlsx workbook with openpyxl.
MistakeReconciling only the dates present in the first source.
InsteadCompare the union of keys so rows missing from either side are reported.
Summary and key terms
- A workbook holds worksheets of cells addressed in A1 notation; ranges such as B2:B8 cover blocks of cells.
- Column letters are a base-26 numbering with no zero: A is 1, Z is 26, AA is 27.
- CSV is best for exchanging plain tables; openpyxl reads and writes real .xlsx workbooks.
- Formula cells read as formula text unless data_only=True; openpyxl never calculates.
- Pivot tables are dictionaries of totals in Python, built with defaultdict or Counter.
- Spreadsheet dates are serial numbers counted from 30 December 1899.
- Neutralize outside text that starts with =, +, - or @, and reconcile sources over the union of their keys.
- workbook
- A spreadsheet file containing one or more worksheets.
- worksheet
- One grid of cells in a workbook.
- A1 notation
- Naming a cell by column letter and row number, such as C7.
- range
- A rectangular block of cells, such as B2:B8.
- formula
- A cell expression starting with = that the spreadsheet calculates.
- pivot table
- A summary grid of totals grouped by two or more fields.
- openpyxl
- A Python library for reading and writing Excel .xlsx files.
- serial date
- A date stored as a count of days from a fixed starting point.
- formula injection
- Untrusted text in an export that a spreadsheet runs as a formula.
- reconciliation
- Checking that two sources of the same figures agree.
Practice problems
Work each problem on paper first, then reveal the answer to check.
What is the column number of AC?
Show answer
29
What does openpyxl return for a formula cell when the workbook is opened normally?
Show answer
The formula text, such as =SUM(B2:B8).
Why might Theo want formulas in his sheet but Anita want values in hers?
Show answer
Theo edits his numbers and wants live totals; Anita needs a fixed record that cannot change.
Which date is serial number 1 when counting from 30 December 1899?
Show answer
31 December 1899.
How should the customer name "=1+1" be written to a CSV export?
Show answer
As '=1+1, with a single quote in front.
Why compare the union of the date keys when reconciling?
Show answer
So days missing from either source are reported as differences.
Lesson quiz · 5 questions
Score 60% or more to complete this lesson.
Create a free account to save your progress, take quizzes and earn a certificate.