
PWR-320 · Lesson 11 of 12 · 25 min
Turbine vibration and inspection
▶ Video coming soon A video version of this lesson is on the way.
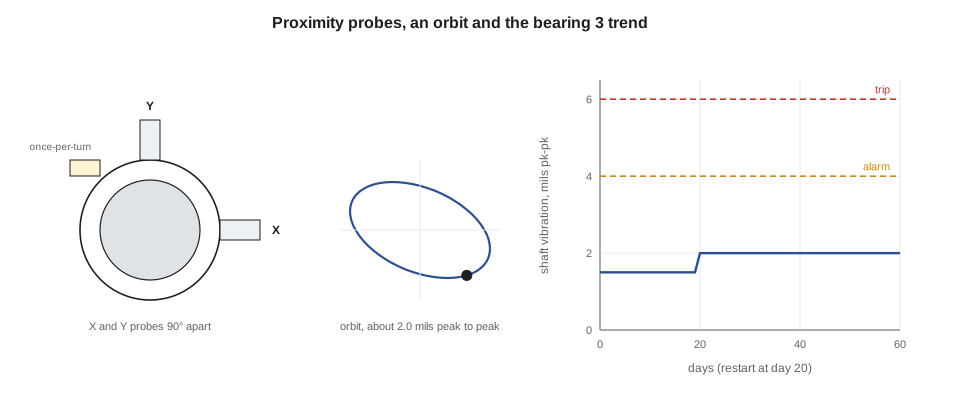
Three weeks after the restart, on Friday, November 13, 2026, Ingeborg Haverlund held her post-outage review of the steam turbine's vibration and performance, and invited Okonkwo to sit in. On the large screen in the engineering office she put up the trend of shaft vibration at each of the four bearings since the restart. Three of them looked much as they had before the outage. Bearing 3, the generator's drive-end bearing, did not: its vibration had settled at about 2.0 mils peak to peak, against about 1.5 mils before the outage. "Still well below our alarm," Ingeborg said. "But it changed when we took the machine apart and put it back together, and I want to know why before it changes again."
This lesson explains how turbine vibration is measured and displayed, what the common causes of vibration look like and how they are told apart, how alarm and trip limits are set, and how inspections and performance tests are used to find deterioration before it causes a failure. It works examples on proximity probe readings, the conversion between displacement and velocity, and a turbine section efficiency test.
Why vibration matters
Every rotating machine vibrates a little, because no rotor is perfectly balanced, aligned and supported. The amount and character of that vibration are the most sensitive signs of its mechanical condition. A change in vibration is often the first warning of a crack, a rub, a loose part, a bearing problem or a lost blade, and a large vibration is itself destructive, wearing seals, fatiguing parts and damaging bearings. Vibration monitoring is therefore both a protection system, with trips that act in seconds, and a diagnostic tool that is used over months and years.
Measuring vibration
Three kinds of transducer are used, measuring different things:
- Proximity probes (eddy current probes) are mounted through the bearing housing and measure the gap between the probe tip and the shaft surface. They read the shaft's motion relative to the bearing, in micrometers or mils peak to peak, which is what matters for oil film and seal clearances. Large turbines have two at each bearing, mounted 90° apart, called X and Y probes, so that the shaft's actual path can be drawn. The same type of probe reads thrust position, eccentricity and differential expansion.
- Velocity transducers and accelerometers are mounted on the bearing housing or casing and measure its absolute motion, usually reported as velocity in millimeters per second or inches per second. Housing measurements suit machines with rolling element bearings or stiff, light rotors, and are the basis of most general machinery vibration standards.
- A shaft rider or a combined probe gives absolute shaft vibration, the sum of the shaft's motion in the bearing and the bearing's motion in space; it is used on some large machines with flexible pedestals.
A once-per-turn reference, a proximity probe that sees a notch or key on the shaft, gives a pulse each revolution. Measured against it, every vibration signal has not only an amplitude but a phase angle, the angle of the shaft at the moment the vibration peaks. Amplitude and phase together, the vibration vector, are what balancing and diagnosis rely on.
Worked problem
Reading a proximity probe
Keswold's proximity probes have a sensitivity of 200 mV/mil. At bearing 3 the X probe's average output is −10.0 V, and its signal swings 0.40 V peak to peak. Find the probe's gap and the shaft vibration.
Show solution
- Gap from the average (gap) voltage:
- \[\text{gap} = \frac{10.0}{0.200} = 50 \text{ mils}\]
- Vibration from the peak to peak signal:
- \[\frac{0.40}{0.200} = 2.0 \text{ mils peak to peak}\]
Answer: The probe sits about 50 mils from the shaft, near the middle of its linear range, and the shaft moves 2.0 mils peak to peak in front of it. The gap voltage itself is trended too: a slow change shows the shaft moving in its bearing, for example as the oil film thickness changes with load or a bearing wears.
Displacement, velocity and acceleration are related through the frequency. For vibration at a single frequency f, the peak velocity is 2πf times the peak displacement. Displacement emphasizes low frequencies, acceleration high ones, and velocity sits between, which is why velocity is the usual general measure of severity.
Worked problem
Displacement to velocity
Express 2.05 mils peak to peak at 60 Hz, the running speed frequency, as a peak velocity.
Show solution
- Peak displacement is half the peak to peak, 1.025 mils = 0.001025 in:
- \[v_{peak} = 2\pi \times 60 \times 0.001025 = 0.39 \text{ in/s}\]
Answer: The conversion only holds for a single frequency and for the same kind of measurement. Shaft relative displacement and housing velocity measure different things and cannot be converted into each other; a stiff housing can show little velocity while the shaft moves a lot within it.
Displaying vibration
Modern monitoring systems turn the probe signals into several standard displays, each suited to a question:
- Trend plots of overall amplitude, 1X amplitude and phase, and gap voltage against time show when something changed.
- The spectrum, from a fast Fourier transform, shows how the vibration is divided among frequencies, labeled as multiples of running speed: 1X, 2X, ½X and so on. A waterfall stacks spectra taken over time or speed.
- The orbit combines the X and Y probe signals to draw the shaft center's path in the bearing, with a mark at each once-per-turn pulse. Its shape and direction tell much about the cause.
- Bode and polar plots, recorded during run-up and coast-down, show 1X amplitude and phase against speed. Each critical speed appears as a peak in amplitude with a swing of phase of about 180°.
What causes vibration and how it shows
Experienced analysts recognize causes from patterns. None of these is a rule, and every diagnosis should be confirmed with more than one piece of evidence, but the common patterns are:
| Cause | Typical frequency | Other signs |
|---|---|---|
| Unbalance | 1X | Steady amplitude and phase at constant speed; amplitude rises with speed; near-circular or elliptical orbit |
| Misalignment | 1X and 2X | High radial load shifts shaft position; banana or figure-eight orbits; high axial vibration on housings; changes with temperature |
| Bent or bowed rotor | 1X | High at slow roll (eccentricity); improves after turning gear if thermal |
| Rub | 1X with changing phase, harmonics, sometimes subsynchronous | Phase rotates slowly as a hot spot moves (a thermal spiral); clipped orbits; noise at glands |
| Oil whirl and oil whip | About 0.4 to 0.48X; whip locks to a critical speed | Large forward orbit, appears suddenly above a threshold speed; tilting pad bearings resist it |
| Looseness | 1X with many harmonics | Erratic phase; worse in one direction |
| Lost blade or part | Sudden step in 1X amplitude and phase | Happens in an instant; trip may follow |
| Shaft crack | 1X and 2X changing over time | Changes in slow roll vector and in 2X through half the critical speed |
| Generator electrical | 2X line frequency, 120 Hz | Disappears instantly when excitation is removed |
Many problems change with load, temperature or time, so the conditions at the moment of each reading must be recorded with it. A vibration that rises with megawatts but not with speed suggests a steam force or a thermal effect; one that rises with field current suggests a generator rotor thermal sensitivity, from a shorted turn or uneven cooling of the winding.
Limits: standards and the manufacturer
The ISO 20816 series of standards, which has replaced the older ISO 10816 and ISO 7919 series, gives guidance for evaluating machine vibration. Part 2 covers large land-based steam turbines and generators above 40 MW at 1,500, 1,800, 3,000 and 3,600 r/min; Part 3 covers industrial machines above 15 kW, which includes a turbine generator of Keswold's size; Part 4 covers gas turbines. The standards define evaluation zones, from zone A for newly commissioned machines, through B (acceptable for long-term operation) and C (not suitable for long-term operation), to D (severe enough to cause damage), with boundaries for both shaft and housing measurements. They also emphasize that a significant change in vibration deserves investigation even inside an acceptable zone.
The standards' zone boundaries are guidance for the typical machine. The manufacturer's own limits, set from the clearances and bearing design of the actual machine, govern its alarm and trip settings. Keswold's turbine generator alarms at 4 mils peak to peak of shaft vibration and trips at 6 mils, with the trip requiring two probes or a time delay, as lesson 6 explained. Bearing 3 at 2.0 mils was in a range that would be considered acceptable for long-term operation, which is why Ingeborg's concern was the change, not the level.
Bearing 3
The data on the screen narrowed the cause down. The increase was almost entirely at 1X. Its phase had shifted by about 30° compared with before the outage and had stayed steady since the restart, at all loads and field currents. The coast-down on the night of October 21, during the overspeed tests, showed the generator's critical speed in the same place as before, at about the same amplitude. Bearing 3's metal temperature and gap voltage were normal. The orbit was a slightly larger version of the old one.
"A steady 1X change with a new phase, appearing right after reassembly," Ingeborg said. "That's a balance change, not a fault developing." The likely culprits were the coupling between turbine and generator, which had been unbolted and remade, and the two packing lands that had been machined on the turbine rotor before it was shop balanced. A small trim balance, a weight added to a balance plane at a calculated angle, should restore the earlier level. She planned to do it at the plant's next short shutdown, when the coupling guard could be removed; in the meantime the bearing would be trended daily with an alert if it rose above 2.6 mils.
Okonkwo asked how a balance weight's angle was worked out. Ingeborg explained the influence coefficient method: a trial weight of known size is fitted at a known angle, the change in the 1X vector it causes is measured, and the ratio of the two gives the machine's response to weight at that plane. The weight needed to cancel the unwanted vector then follows by vector arithmetic. The manufacturer's records from earlier balancing of the same rotor usually provide the coefficients, so that a single shot is often enough.
Inspection programs
Vibration monitoring finds problems that show while the machine runs. Many do not, and are found only by inspection. Turbine inspection programs are set by the manufacturer, the insurer and the owner's own experience, at intervals based on operating hours, starts and findings:
- Online monitoring and tests: vibration, thrust, expansion, bearing temperatures, oil analysis, valve tests, first stage shell pressure trend and performance tests.
- Minor inspections, at shorter intervals, without lifting the casing: valves, couplings, bearings, controls, borescope inspection through access ports.
- Major inspections, typically at intervals of several years, with the casing lifted and the rotor removed, as at Keswold this fall: blading, diaphragms, packing, rotor, casing, bearings and valves.
The inspection methods are those met in PWR-220 and earlier courses: visual and borescope inspection; magnetic particle and liquid penetrant testing for surface cracks; ultrasonic testing, including phased array, for internal flaws in rotors, blade roots and bolts; eddy current testing of blade roots, bores and tubes; hardness and replication tests for creep damage in high-temperature parts; and dimensional checks of clearances, bow and journal condition. Boresonic inspection of rotors with central bores, and retaining ring inspection of generator rotors, are specialized examinations on many large units.
Performance tests
A turbine that is deteriorating often shows it first as a loss of efficiency: deposits narrow the steam passages, eroded or damaged blades waste energy, and worn packing lets steam bypass the stages. The simplest test is the section efficiency test, which uses the same expansion calculation as PWR-310. For a section that exhausts superheated steam, the measured pressure and temperature at its inlet and outlet give the actual enthalpy drop, and the isentropic drop follows from the inlet entropy and outlet pressure.
Worked problem
Keswold's high-pressure section before and after
Keswold's turbine inlet is at 880 psia and 900 °F (h = 1,453.0 Btu/lb). The isentropic enthalpy at the 175 psia extraction is 1,260.3 Btu/lb. Before the outage the extraction temperature was 551.3 °F (h = 1,298.9 Btu/lb); after the outage, at the same conditions, it was 543.0 °F (h = 1,294.5 Btu/lb). Find the section efficiency before and after.
Show solution
- Isentropic drop:
- \[1{,}453.0 - 1{,}260.3 = 192.7 \text{ Btu/lb}\]
- Before:
- \[\eta = \frac{1{,}453.0 - 1{,}298.9}{192.7} = 0.800\]
- After:
- \[\eta = \frac{1{,}453.0 - 1{,}294.5}{192.7} = 0.822\]
Answer: The high-pressure section improved by about two points of efficiency, from cleaning the deposits off the early stages and replacing the worn packing. A lower extraction temperature at the same inlet conditions and pressure means more of the steam's energy went into the rotor. On 175,000 lb/h, two points of section efficiency is worth about 175,000 × 0.022 × 192.7 ÷ 3,412 = 217 kW at the shaft.
The low-pressure section cannot be tested this way, because its exhaust is wet steam whose enthalpy cannot be found from pressure and temperature. Its performance is followed through the overall heat balance, the generator output, and the stage pressures along the section, which rise above their normal values when the passages downstream of them are restricted. Keswold records the first stage shell and several stage pressures each day; Ingeborg compared them with their post-outage baseline at every review.
The review finished with a list: bearing 3 trim balance at the next short shutdown; a steam purity review with the water treatment supplier in response to the silica deposits found in September; the new HP section efficiency as the baseline for the coming year; and the condenser UA trend, which had recovered after the cleaning, to be watched for fouling through the winter.
Common mistakes
MistakeComparing proximity probe readings with housing velocity limits.
InsteadShaft relative displacement and housing velocity measure different things; use the limits that apply to each.
MistakeReading vibration amplitude without phase.
InsteadAmplitude and phase together form the vector used for diagnosis and balancing.
MistakeConverting displacement to velocity with the peak to peak value.
InsteadUse peak displacement, half the peak to peak, in v_peak = 2πf × d_peak, at a single frequency.
MistakeIgnoring a change in vibration because it is still below the alarm.
InsteadA significant change deserves investigation even inside an acceptable zone.
MistakeTesting the low-pressure section's efficiency from exhaust pressure and temperature.
InsteadWet exhaust enthalpy cannot be found from p and T; use the heat balance and stage pressures.
Summary and key terms
- Proximity probes measure shaft motion relative to the bearing; velocity transducers and accelerometers measure housing motion.
- A once-per-turn reference gives phase; amplitude and phase form the vibration vector.
- Trends, spectra, orbits and Bode plots each answer different diagnostic questions.
- Unbalance, misalignment, rubs, oil whirl, looseness, cracks and electrical causes have characteristic patterns.
- ISO 20816 gives evaluation zones; the manufacturer's limits govern alarms and trips; changes matter as well as levels.
- Inspections and section efficiency tests find deterioration that monitoring does not.
- Proximity probe
- An eddy current probe that measures the gap to a shaft surface, giving shaft relative vibration and position.
- Peak to peak
- The total excursion of a vibration signal from its most negative to its most positive value.
- Once-per-turn reference
- A pulse from a shaft notch or key used to measure vibration phase.
- Vibration vector
- The amplitude and phase of a vibration component, usually at 1X.
- Orbit
- The path of the shaft center in its bearing, drawn from X and Y probe signals.
- Oil whirl
- A self-excited vibration of a shaft in its oil film at a little under half running speed.
- Trim balance
- A small correction weight added to a rotor in service to reduce 1X vibration.
- Influence coefficient
- The change in vibration vector produced by a unit weight at a given plane and angle.
- Section efficiency test
- A test of a turbine section's isentropic efficiency from measured inlet and outlet conditions.
Practice problems
Work each problem on paper first, then reveal the answer to check.
A probe at 200 mV/mil reads −8.5 V with a 0.24 V peak to peak signal. Find the gap and vibration.
Show answer
Gap 42.5 mils; 0.24 ÷ 0.200 = 1.2 mils peak to peak.
Convert 1.2 mils peak to peak at 60 Hz to peak velocity.
Show answer
2π × 60 × 0.0006 = 0.23 in/s peak.
A section's isentropic drop is 172 Btu/lb and its actual drop 142 Btu/lb. Find its efficiency.
Show answer
142 ÷ 172 = 0.826.
What vibration frequency points to an electrical cause in a 60 Hz generator?
Show answer
120 Hz, twice line frequency, which vanishes when excitation is removed.
Lesson quiz · 5 questions
Score 60% or more to complete this lesson.
Create a free account to save your progress, take quizzes and earn a certificate.