
NUC-350 · Lesson 5 of 12 · 22 min
Fission product poisoning: xenon and samarium
On Hana's third week, one of TVA's units trips from full power on a turbine fault and is ready to return to power seven hours later. The control room calls the core physics engineer on duty. "What boron do we need for the restart?" the shift manager asks. Teodora checks the time since the trip. "Xenon is near its peak right now," she says. "We can restart, but the critical boron will be much lower than before the trip, and as the xenon burns out after restart we will be diluting and then borating to follow it." Hana spends the afternoon working out why.
Two poisons that behave differently
Among the hundreds of fission products, two have thermal absorption cross sections so large that they dominate the short-term reactivity behavior of every thermal reactor. Xenon-135 has a thermal absorption cross section of about 2.6 million barns, the largest of any known nuclide. Samarium-149 has about 41 000 barns. Both are produced mainly by the decay of other fission products, and both are removed mainly by absorbing neutrons. The difference is that xenon-135 is radioactive, with a half-life of about 9.1 hours, while samarium-149 is stable.
| Nuclide | Main production | Half-life | Thermal absorption | Main removal |
|---|---|---|---|---|
| Iodine-135 | fission yield about 6.4 % | 6.6 h | small | decay to xenon-135 |
| Xenon-135 | decay of iodine-135; direct yield about 0.2 % | 9.1 h | about 2.6 × 10⁶ b | absorption and decay |
| Promethium-149 | fission yield about 1.1 % (via neodymium-149) | 53 h | moderate | decay to samarium-149 |
| Samarium-149 | decay of promethium-149 | stable | about 4.1 × 10⁴ b | absorption only |
Xenon at equilibrium
In a reactor at steady power, iodine-135 and xenon-135 reach equilibrium concentrations within about two days. Setting the time derivatives to zero gives, for a thermal flux φ and macroscopic fission cross section Σ_f:
The equilibrium xenon concentration rises with flux but saturates: at high flux, xenon is destroyed by absorption as fast as it is produced. The reactivity worth of equilibrium xenon in a critical reactor can be written, using νΣ_f ≈ Σ_a for the core:
The flux φ_X is about 0.8 × 10¹³ n/cm²·s. In power reactors, where the thermal flux is a few times larger, equilibrium xenon worth approaches its limiting value of about (γ_I + γ_X)/ν, a little under 3 percent in reactivity. That is about 2 000 to 3 000 pcm, or 20 to 30 milli-k, a substantial part of the excess reactivity that a core must carry.
Xenon after shutdown
When a reactor shuts down, the flux falls to nearly zero. Xenon production from iodine decay continues for hours, because the iodine inventory decays with a 6.6-hour half-life, but xenon removal by neutron absorption stops. Xenon therefore builds up after shutdown, reaching a peak some hours later before decaying away. The concentration after shutdown, starting from equilibrium, is:
The higher the flux before shutdown, the larger the iodine inventory relative to the xenon, and the larger and later the peak. The program below calculates equilibrium xenon worth and the post-shutdown peak for two thermal fluxes, and the equilibrium samarium worth.
# Xenon-135 and samarium-149 in a thermal reactor (point model).
# Yields and decay constants are standard textbook values for U-235 fission.
import math
gI, gX, lI, lX, sX = 0.0639, 0.00237, 2.87e-5, 2.09e-5, 2.65e-18     # sX in cm^2
gP, lP, sS = 0.0113, 3.63e-6, 4.1e-20
nu = 2.43
def xe_eq_rho(phi):
    """Equilibrium xenon reactivity, using rho = -(gamma_I+gamma_X)/nu * phi/(phi+phi_X)."""
    phiX = lX / sX
    return -(gI + gX) / nu * phi / (phi + phiX)
def sm_eq_rho():
    return -gP / nu                     # independent of flux at equilibrium
def after_shutdown(phi, hours):
    """Xenon reactivity after a trip from equilibrium at flux phi.
    Concentrations are per unit Sigma_f, so rho = -sigma_X * X / nu."""
    I0 = gI * phi / lI
    X0 = (gI + gX) * phi / (lX + sX * phi)
    t = hours * 3600
    X = X0 * math.exp(-lX * t) + I0 * lI / (lX - lI) * (math.exp(-lI * t) - math.exp(-lX * t))
    return -X * sX / nu
for name, phi in (("PWR-like, phi = 3e13", 3e13), ("CANDU-like, phi = 7e13", 7e13)):
    r = xe_eq_rho(phi)
    print(f"{name}: equilibrium xenon {r*1e5:7.0f} pcm ({r*1e3:5.1f} mk)")
    peak_t, peak = 0, 0.0
    for h in range(0, 61):
        val = after_shutdown(phi, h)
        if val < peak: peak, peak_t = val, h
    eq = after_shutdown(phi, 0)
    print(f"   after a trip the xenon worth peaks near {peak_t} h at {peak*1e5:7.0f} pcm, "
          f"{peak/eq:.2f} times its equilibrium value")
print(f"samarium-149 at equilibrium: {sm_eq_rho()*1e5:.0f} pcm, independent of flux; it does not decay, so it stays after shutdown")PWR-like, phi = 3e13: equilibrium xenon -2159 pcm (-21.6 mk) after a trip the xenon worth peaks near 9 h at -4138 pcm, 1.92 times its equilibrium value CANDU-like, phi = 7e13: equilibrium xenon -2451 pcm (-24.5 mk) after a trip the xenon worth peaks near 10 h at -8370 pcm, 3.41 times its equilibrium value samarium-149 at equilibrium: -465 pcm, independent of flux; it does not decay, so it stays after shutdown
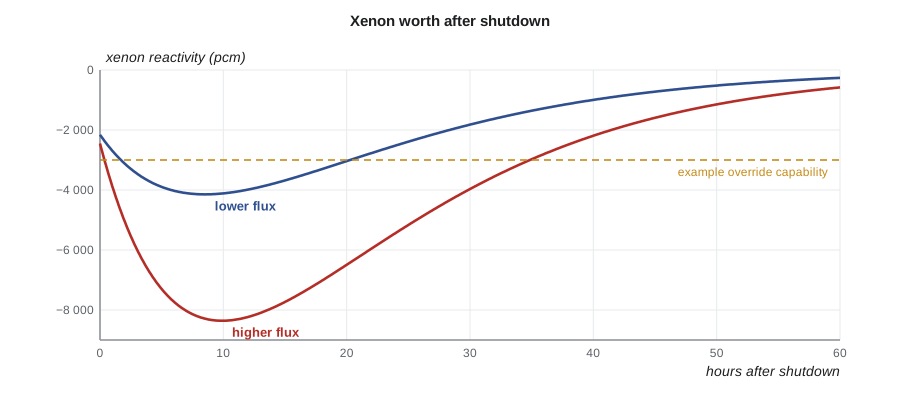
The higher-flux case peaks at more than three times its equilibrium worth. This is the case for reactors with high thermal flux, and it is why the time just after a trip matters so much in practice.
In a pressurized water reactor, soluble boron gives the operators a large and flexible way to compensate. Early in the cycle, when the boron concentration is high, there is enough boron to remove to overcome the xenon peak, and the unit can usually restart at any time after a trip. Late in the cycle, when the boron concentration is already low, there may be too little left to dilute, and a restart near the xenon peak may not be possible until the xenon decays. Operators plan the dilution and boration that follow a restart, because xenon burns out quickly once the flux returns.
Worked problem
Equilibrium xenon worth
Estimate the equilibrium xenon reactivity for a thermal flux of 3 × 10¹³ n/cm²·s, with γ_I + γ_X = 0.0663, ν = 2.43 and φ_X = 0.79 × 10¹³ n/cm²·s.
Show solution
- Limiting worth: (γ_I + γ_X)/ν = 0.0663/2.43 = 0.0273.
- Flux factor: φ/(φ + φ_X) = 3.0/(3.0 + 0.79) = 0.792.
- ρ_X ≈ −0.0273 × 0.792 = −0.0216, or about −2 160 pcm.
Answer: Equilibrium xenon is worth roughly 22 milli-k, which matches the program output and must be accounted for whenever the reactor changes power.
Samarium
Samarium-149 builds up more slowly, through the 53-hour decay of promethium-149, and its equilibrium worth does not depend on flux:
This gives about −460 pcm, or −4.6 milli-k, for uranium-235 fission. Because samarium is stable, it does not decay after shutdown. Instead, the promethium inventory continues to decay to samarium, and the samarium worth rises after shutdown to a new, higher level that remains until the reactor operates again and burns it off. This post-shutdown samarium increase is smaller than the xenon peak but permanent until restart, and core designers include it in shutdown margin and restart calculations.
Xenon oscillations
Xenon also affects the spatial power distribution. In a large core, if power rises in one region, xenon is burned out there at first, raising reactivity and power further; hours later, extra iodine decays to extra xenon, which lowers reactivity there. Meanwhile the opposite happens in the region where power fell. The result can be a slow oscillation of power between regions, with a period of roughly a day. Whether such oscillations grow or die out depends on the size of the core in migration lengths, the power level, the power coefficient and the burnup.
Large PWR cores are susceptible mainly to axial xenon oscillations, in which power shifts between the top and bottom halves of the core. Operators control them by monitoring the axial flux difference, the difference between the top and bottom ex-core detector readings, and moving control banks to keep it within a target band. Boiling water reactors such as the BWRX-300 have strong void feedback, which tends to damp xenon oscillations in the axial direction.
Xenon after power changes
Xenon also changes after any change in power, not only after a trip. When power is reduced, xenon builds up for several hours, as it does after a shutdown but to a smaller extent, and then settles at a new, lower equilibrium. When power is raised, the stronger flux burns out xenon faster than the iodine can replace it, so xenon falls at first, adding reactivity, and then rises to its new, higher equilibrium. The operators must compensate for these swings with control rods, boron or zone controllers. A load-following plant that changes power daily must plan its xenon carefully, which is one reason many power reactors are run at constant full power when they can be.
| Event | Xenon response in the first hours | Reactivity effect |
|---|---|---|
| Trip from full power | rises to a peak near 10 hours | large negative swing; restart may be limited |
| Power reduction to 50 % | rises for several hours, then settles lower | negative, then partly recovers |
| Power increase to 100 % | falls at first, then rises to a higher equilibrium | positive, then negative |
| Restart after a long shutdown | builds from zero over about two days | steady negative trend |
Iodine and xenon in the core model
Core simulators do not use the point model of this lesson. They track iodine and xenon in every node, using the local flux, so that changes in the power distribution after a control action or a refueling are followed in space. The equilibrium and post-shutdown relations derived here are still the basis of those calculations, written for each node with its own flux and fission rate. In a CANDU core, where the flux is high and the core is large, the local xenon follows the local power closely, and the zone controllers respond to the combined effect. In a PWR, the axial distribution of xenon after a power change can shift power toward the top or bottom of the core and must be watched through the axial flux difference.
Worked problem
Xenon override time
A CANDU unit at a thermal flux of 7 × 10¹³ n/cm²·s trips. Its adjusters can supply about 15 mk. Using the same constants as the program, estimate how quickly xenon worth rises just after the trip and how long the restart window lasts.
Show solution
- Just after the trip, xenon is produced by iodine decay at γ_I φ Σ_f and removed only by decay, λ_X X_∞. With the equilibrium values, the net production is about 4.0 × 10¹² per unit Σ_f per second.
- The reactivity rate is σ_X × 4.0 × 10¹²/ν = 2.65 × 10⁻¹⁸ × 4.0 × 10¹²/2.43 ≈ 4.4 × 10⁻⁶ per second, or about 16 mk per hour.
- At that rate, the extra 15 mk is used up in a little under an hour.
Answer: The restart window is a matter of tens of minutes to an hour or so, which is why CANDU operators treat a prompt, safe return to power after a trip as an important goal.
Operators plan around these effects every day. Before a planned power reduction, the physics group predicts the xenon transient that will follow, so that the control room knows how much the control devices or boron will need to move, and when the return to full power is possible. After an unplanned trip, the time available to restart before xenon builds beyond the available excess reactivity is a key consideration, and procedures give that time for each unit. During extended low-power operation, the slow approach of xenon to its new, lower equilibrium also needs to be followed, because the reactivity released by that decrease must be absorbed by the control system.
Common mistakes
MistakeXenon worth falls immediately after a reactor shuts down.
InsteadIt rises for several hours, because iodine keeps decaying to xenon while absorption has stopped.
MistakeSamarium decays away after shutdown, like xenon.
InsteadSamarium-149 is stable; its worth rises after shutdown and stays until the reactor runs again.
MistakeEquilibrium xenon worth grows in proportion to flux without limit.
InsteadIt saturates at high flux, approaching about (γ_I + γ_X)/ν.
Summary and key terms
- Xenon-135 and samarium-149 are the dominant fission product poisons in thermal reactors.
- Equilibrium xenon worth saturates near 2 000 to 3 000 pcm at power-reactor fluxes.
- After a trip, xenon peaks hours later, more strongly for higher pre-trip flux.
- Samarium is stable; its worth rises after shutdown and persists until restart.
- Xenon can drive slow spatial power oscillations that operators must control.
- Xenon-135
- A fission product with a very large thermal absorption cross section and a 9.1-hour half-life.
- Iodine pit
- The xenon peak after shutdown, during which a reactor may be unable to restart.
- Poison-out
- The state in which xenon worth exceeds the available reactivity, so the reactor cannot restart.
- Samarium-149
- A stable fission product poison formed by decay of promethium-149.
- Xenon oscillation
- A slow shift of power between core regions caused by xenon production and burnout.
- Axial flux difference
- The difference in power between the top and bottom halves of a PWR core.
Practice problems
Work each problem on paper first, then reveal the answer to check.
Why does xenon peak after shutdown?
Show answer
Iodine continues to decay to xenon while neutron absorption, the main removal path, has stopped.
What is the approximate limiting equilibrium xenon worth?
Show answer
About (γ_I + γ_X)/ν, a little under 3 percent.
Why is samarium worth independent of flux at equilibrium?
Show answer
Both its production and its removal are proportional to flux, so the flux cancels.
What is meant by a reactor poisoning out?
Show answer
Xenon worth exceeds the available excess reactivity, so the reactor cannot be made critical until the xenon decays.
How do PWR operators control axial xenon oscillations?
Show answer
By monitoring the axial flux difference and moving control banks to keep it within a target band.
Lesson quiz · 5 questions
Score 60% or more to complete this lesson.
Create a free account to save your progress, take quizzes and earn a certificate.