
MSAZ-312 · Lesson 10 of 12 · 21 min
Impact analysis and lineage
▶ Video coming soon A video version of this lesson is on the way.
Tuesday, November 10 began with a message from Ines Duarte. She wanted to tidy the wh_sales warehouse before the pilot: rename the fact_sales column DiscountAmt to DiscountAmount to match the naming standard, and drop the TillNote column that lesson 7 had left out of Sales Overview. Both changes were small in the warehouse. Marisol's first question was who would notice. After lesson 9, Finance Margin was a shared model with thin reports hanging off it, and the warehouse fed three semantic models. A rename that took Ines a minute could break reports for people she had never met. This session was about finding out before the change, not after.
Lineage view
Every Fabric workspace has a lineage view, opened from the workspace's view options. It draws the workspace's items as cards from left to right, from data sources through lakehouses, warehouses, pipelines, dataflows and semantic models to reports, dashboards and apps, with arrows for the dependencies between them. Items in other workspaces that the workspace depends on, or that depend on it, appear as cards too, marked as being in another workspace. Each card shows the item's type and name and gives access to its details. A single item's lineage can also be opened from its details page, which shows that item's upstream and downstream connections across workspaces.
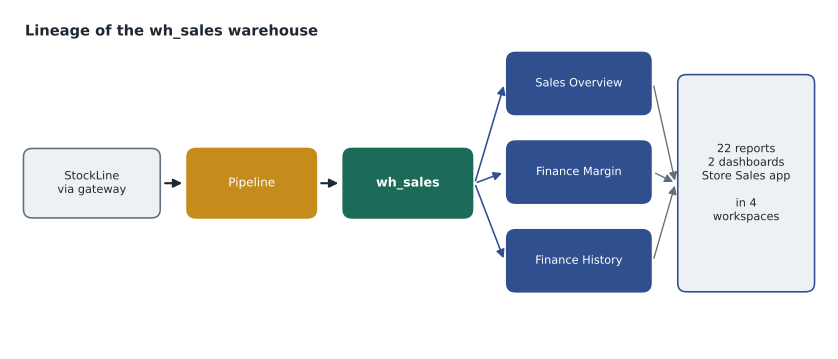
Keiko opened the lineage view of the FDH-Sales workspace, where wh_sales lived. It showed the pipelines that loaded it on the left, the warehouse in the middle, and on the right three semantic models: Sales Overview in the same workspace, and Finance Margin and Finance History in FDH-Finance. From each model further arrows led to reports and an app. The picture alone answered the first question: the change reached at least two workspaces and all three models.
Impact analysis
Impact analysis turns the picture into numbers. It is opened from an item's card in lineage view or from the Lineage option on the item's details page, and it lists everything downstream of the item that a change could affect. Two scopes are shown: child items, the items that depend on it directly, and all downstream items, everything further along. Both can be browsed by item type or by workspace, and both show how many items and how many workspaces are affected. A user needs write permission on an item to run impact analysis on it.
| Scope for wh_sales | Items | Workspaces |
|---|---|---|
| Child items | 3 semantic models | 2 |
| All downstream items | 3 semantic models, 22 reports, 2 dashboards, 1 app | 4 |
| Of which limited access | 1 report | 1 |
Two things in the result surprised the group. Four workspaces were affected, not two: the finance analysts had built two reports in their own team workspace, and the Store Sales app published from FDH-Sales was a separate item. And one report was shown as limited access. Impact analysis hides the names of items that the person running it cannot see, because a name can itself contain sensitive information, and shows only that the item exists. Keiko could not open it; Elena could, and found a report that the merchandising team had built on Sales Overview in their own workspace in October.
For data sources the pane shows only the direct children, so the view of a source such as the gateway connection stops one step downstream; to go further, the analysis is run again on each child. That was not a problem here, since the warehouse was the item being changed. Marisol pointed out that it would matter if StockLine itself changed, as it might in MSAZ-121's migration plans.
Notifying contacts
The impact analysis pane has a Notify contacts option. The person running it writes a description of the planned change and sends it, and an email goes to the contact lists of every affected workspace, including workspaces that the sender cannot access. The email shows the sender's name so that recipients can reply. Before sending, Marisol checked the contact lists of the four workspaces: the FDH-Finance list was still set to its default, the workspace admins, so she added the finance analysts' group. A notification is only as useful as the lists it goes to.
Planned change to wh_sales.fact_sales, Thursday, November 19, 2026, 7:00 p.m.
1. Column DiscountAmt renamed to DiscountAmount.
2. Column TillNote removed (not used by Sales Overview since November 5).
Affected: Sales Overview, Finance Margin, Finance History and reports built on them.
Action needed: reports that use DiscountAmt directly in Power Query or SQL must be updated.
Questions: reply to this message or ask in the Finch Data Hub channel.
Below the item level
Impact analysis works on items, not columns. It said that 22 reports depended on the warehouse, but not which of them used DiscountAmt. The models were the place to find out, because reports do not read the warehouse directly; they read the models' columns and measures. Keiko opened each model's definition in the project folder. In Sales Overview, DiscountAmt fed one measure, Discount Total, and was hidden; in Finance Margin it fed two measures; Finance History did not use it. Tabular Editor shows an object's dependencies, and DAX has INFO functions that list them from a query, which semantic link can run from a notebook across many models.
The rename could then be absorbed in the models without touching any report. In the two models that used the column, Rosa and Keiko changed the source column name in the table's definition but kept the model column's name, so every measure and every report kept working. The models' lineage tag stayed the same. Only one report needed a change: an analyst's report in the finance team workspace that read the warehouse directly through a .pbids connection from lesson 9 and used DiscountAmt in a native SQL query. Rosa rewrote it as a thin report on Finance Margin.
# Which measures use a given column? A tiny dependency walk.
measures = {
    "Discount Total": ["fact_sales[DiscountAmt]"],
    "Net Sales": ["[Total Sales]", "[Discount Total]"],
    "Total Sales": ["fact_sales[SalesAmount]"],
    "Net Margin": ["[Net Sales]", "[Total Cost]"],
    "Total Cost": ["fact_sales[CostAmount]"],
}

def uses(name, target, seen=()):
    for ref in measures.get(name, []):
        if ref == target:
            return True
        inner = ref.strip("[]")
        if inner in measures and inner not in seen and uses(inner, target, seen + (name,)):
            return True
    return False

hit = [m for m in measures if uses(m, "fact_sales[DiscountAmt]")]
print("Measures depending on DiscountAmt:", hit)Measures depending on DiscountAmt: ['Discount Total', 'Net Sales', 'Net Margin']
What this code does
The block stores each measure with the columns and measures it refers to. A small function follows those references down, step by step, until it either finds the column being changed or runs out of references, and it remembers where it has been so it cannot loop. The last line prints every measure that would be affected by renaming the discount column, including ones that use it only through another measure.
The walk found three measures, not one: Discount Total used the column directly, and Net Sales and Net Margin used it through Discount Total. Keiko said this was exactly the kind of chain that people miss by reading one measure at a time. Because the model column kept its name, none of the three needed changing, but the list went into the change record.
Change across stages: deployment pipelines
Lesson 6 left one question open: how changes move from development to production. Fabric deployment pipelines answer it. A pipeline has between 2 and 10 stages, by default three named Development, Test and Production, and each stage is assigned one workspace. Deploying copies the selected items from one stage to the next, overwriting their paired items there; items that exist only in the target are left alone. The pipeline compares stages and marks items that differ, and lineage determines the order of deployment, so that a model is deployed before the reports that depend on it.
For semantic models, deployment copies the definition, not the data. The first time a model is deployed into an empty stage it has to be refreshed there. After that, deployments update the metadata of the model in the target and keep its data, which is why Marisol was happy to use pipelines for Finance Margin with its incremental refresh partitions. Deployment rules let a stage use different values for data source connections and parameters, so the Test stage's Finance Margin could read a copy of the warehouse while Production read the real one.
| Stage | Workspace | Data source (deployment rule) | Who deploys into it |
|---|---|---|---|
| Development | FDH-Finance-Dev | wh_sales_dev | BI developers, from Git |
| Test | FDH-Finance-Test | wh_sales_test, refreshed weekly | Keiko or Rosa |
| Production | FDH-Finance | wh_sales | Marisol, after the checklist |
The Development workspace was connected to the hub's Git repository, so changes reached it from pull requests; the pipeline then carried them to Test and Production. Marisol added impact analysis to the checklist for every deployment to Production that changed a column or a measure's name, with Notify contacts for any change that a report author might notice.
Worked problem
Reading an impact analysis
A semantic model has 4 child items: 3 reports and 1 dashboard in 2 workspaces. All downstream items number 7: the same 4, plus 2 reports in another workspace built on a composite model over it, and 1 app. How many workspaces would Notify contacts reach, and what should the owner check before sending?
Show solution
- Child items are in 2 workspaces.
- The 2 further reports are in another workspace, a third.
- The app is published from a workspace; if it is one of the first two, the total stays at 3.
- Notify contacts reaches the contact lists of all affected workspaces, so the owner should check that each list holds the right people, not just the default admins.
Answer: At least 3 workspaces, more if the app comes from another one. Check the contact lists first.
Seeing lineage across the tenant
Lineage view shows one workspace at a time, with items from other workspaces at its edges. Elena explained that administrators have wider views. The OneLake catalog lets users find items across the workspaces they can see and open each item's lineage. For the whole tenant, Fabric administrators can use the admin APIs that scan workspaces' metadata, which return items, their data sources and the relationships between them, including details such as tables and measures of semantic models when metadata scanning is enabled in the tenant settings. Microsoft Purview can also read that metadata into its own data map, where lineage is shown alongside items from systems outside Fabric. Elena ran the scanner once a week into a lakehouse table, which is how Keiko had found the analysts' 17 reports in lesson 9.
Marisol drew a distinction the group found useful. Lineage answers where something came from and where it goes; impact analysis answers who will notice if it changes. Both rely on Fabric knowing the connections, and both have blind spots. A report that reads a warehouse through a native SQL query appears in lineage as connected to the warehouse, but nobody can tell from the picture which columns the SQL uses. Excel workbooks that connect to a model with Analyze in Excel do not appear as Fabric items at all. And a notebook that reads a table by path may show its connection only in the notebook's code. For those, the change record relied on the notification and on Ines's warehouse query history, which listed every query that had named DiscountAmt in the previous 30 days.
That history found one more user: a scheduled export that Nikolai had set up in September for a supplier, which read fact_sales with DiscountAmt in its SQL. It did not appear in impact analysis because it ran from a pipeline in another workspace using a connection rather than a direct dependency. Nikolai updated it the same afternoon, and Marisol added the warehouse query history check to the checklist for column changes.
Common mistakes
MistakeImpact analysis shows which reports use a column.
InsteadIt works on items; column use is found in the models' definitions and dependencies.
MistakeItems you cannot open are left out of impact analysis.
InsteadThey are counted and shown as limited access, without their names.
MistakeNotify contacts emails everyone who uses the reports.
InsteadIt emails the workspace contact lists, which default to the admins unless changed.
MistakeDeploying a model through a pipeline replaces its data.
InsteadDeployment updates the definition and keeps the data, except on the first deployment into a stage.
Summary and key terms
- Lineage view shows a workspace's items and their dependencies, including items in other workspaces.
- Impact analysis lists child items and all downstream items, by type or by workspace, with counts.
- It needs write permission on the item and shows inaccessible items as limited access.
- Notify contacts emails the contact lists of every affected workspace.
- Column-level dependencies are found in models' definitions, Tabular Editor or DAX INFO functions.
- Deployment pipelines have 2 to 10 stages, deploy definitions and keep model data, and use rules for per-stage sources.
- Lineage view
- A diagram of a workspace's items and the dependencies between them.
- Impact analysis
- A pane listing the items downstream of an item that a change could affect.
- Child items
- Items that depend directly on the item being analyzed.
- Limited access
- How impact analysis shows items the user cannot open, without their names.
- Notify contacts
- An impact analysis option that emails the contact lists of affected workspaces.
- Deployment pipeline
- A Fabric feature that moves items between workspaces assigned to stages.
- Deployment rule
- A per-stage setting that changes a data source or parameter value on deployment.
Practice problems
Work each problem on paper first, then reveal the answer to check.
Which two scopes does impact analysis show?
Show answer
Child items and all downstream items.
Why was one report shown as limited access?
Show answer
Keiko could not open it, and impact analysis hides names of items the user cannot access.
What did Marisol change before sending the notification?
Show answer
She added the finance analysts' group to the FDH-Finance contact list.
How was the rename absorbed without changing reports?
Show answer
The models' source column names were updated while the model column names stayed the same.
How many measures depended on DiscountAmt, and how?
Show answer
Three: one directly and two through it.
Lesson quiz · 5 questions
Score 60% or more to complete this lesson.
Create a free account to save your progress, take quizzes and earn a certificate.